Ultimate Dynasties
An interactive data visualization exploring the history of college ultimate frisbee.

Why I Made This Chart
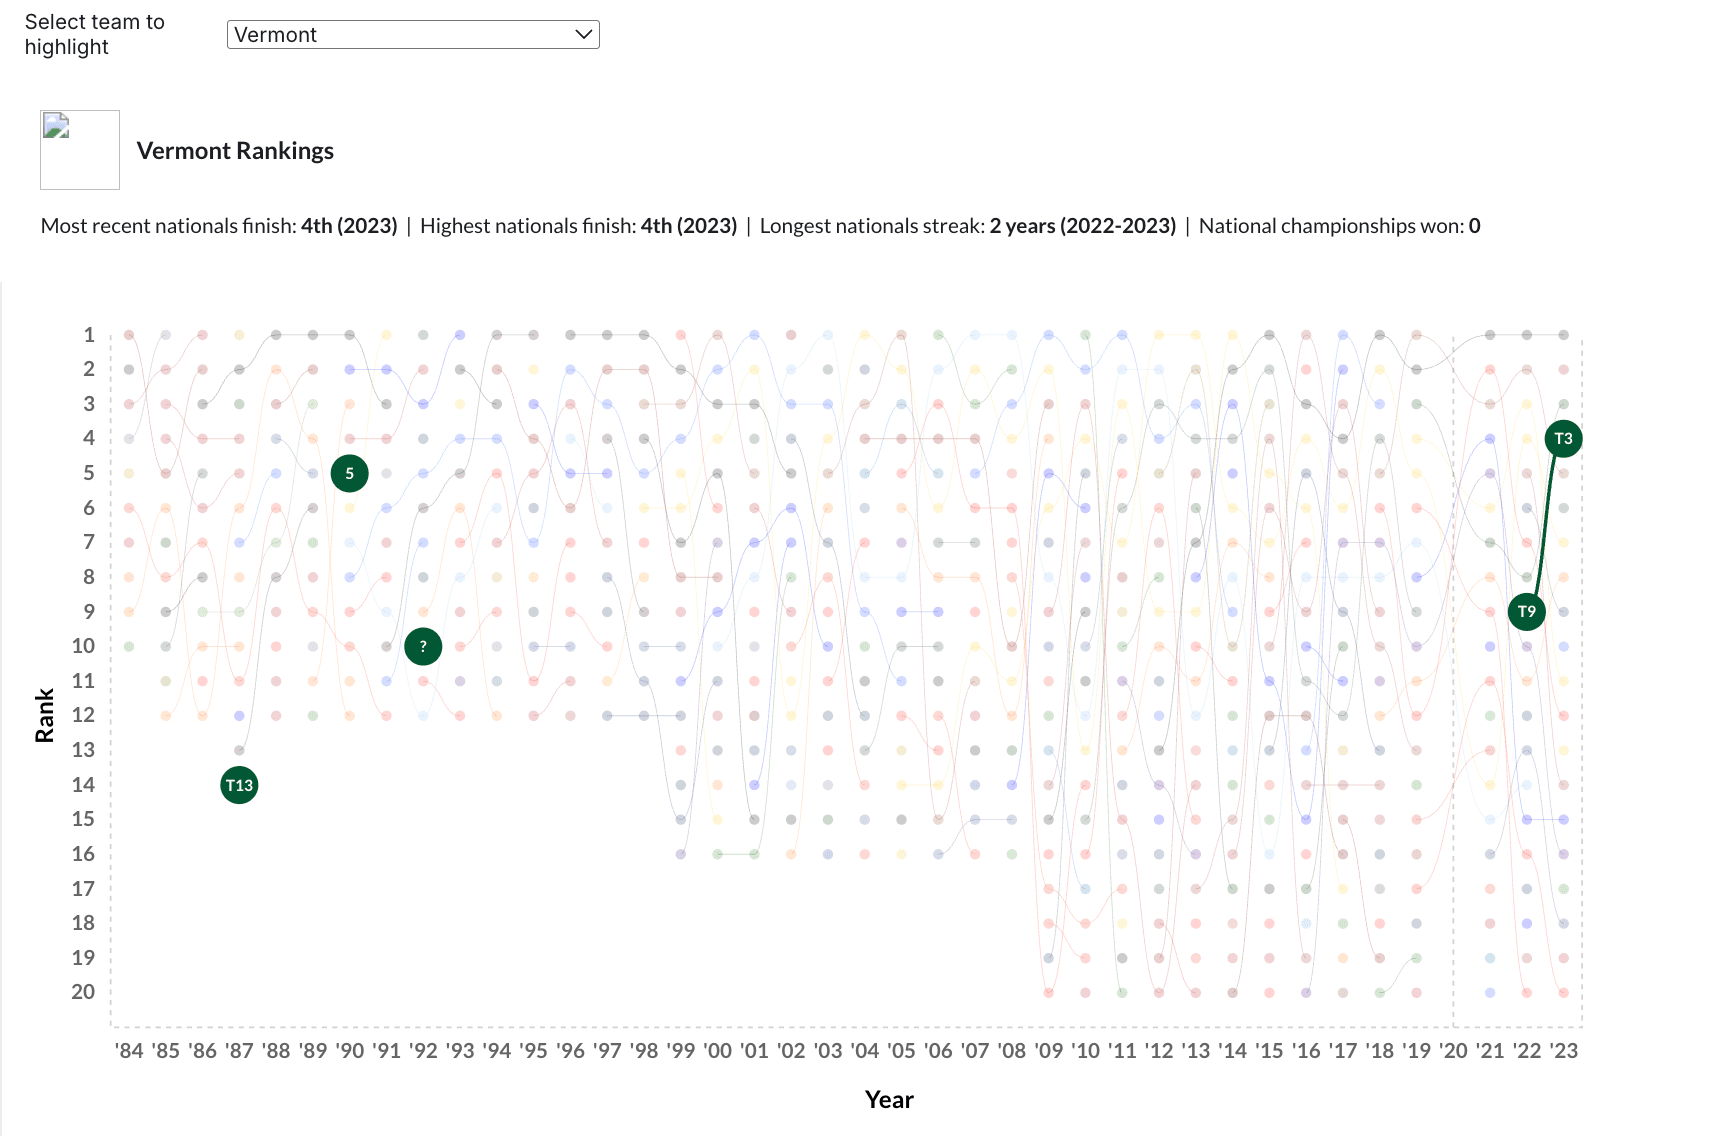
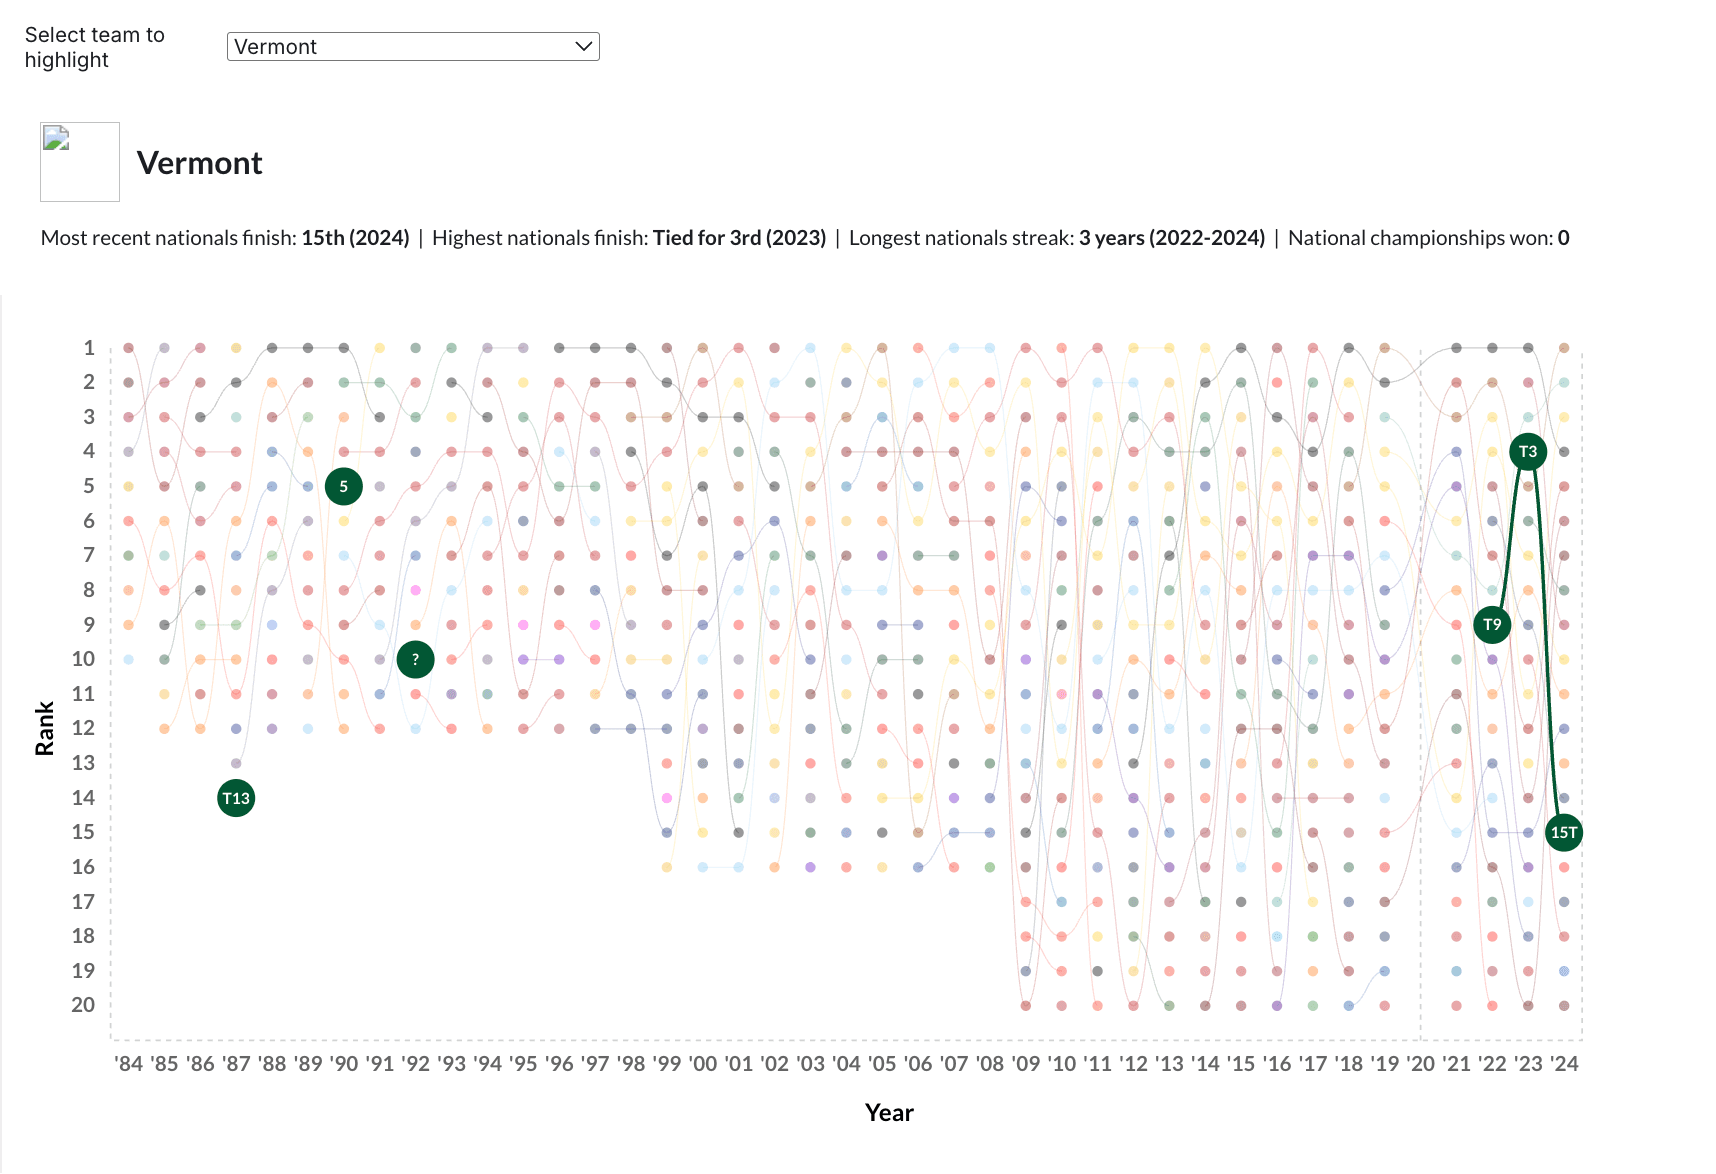
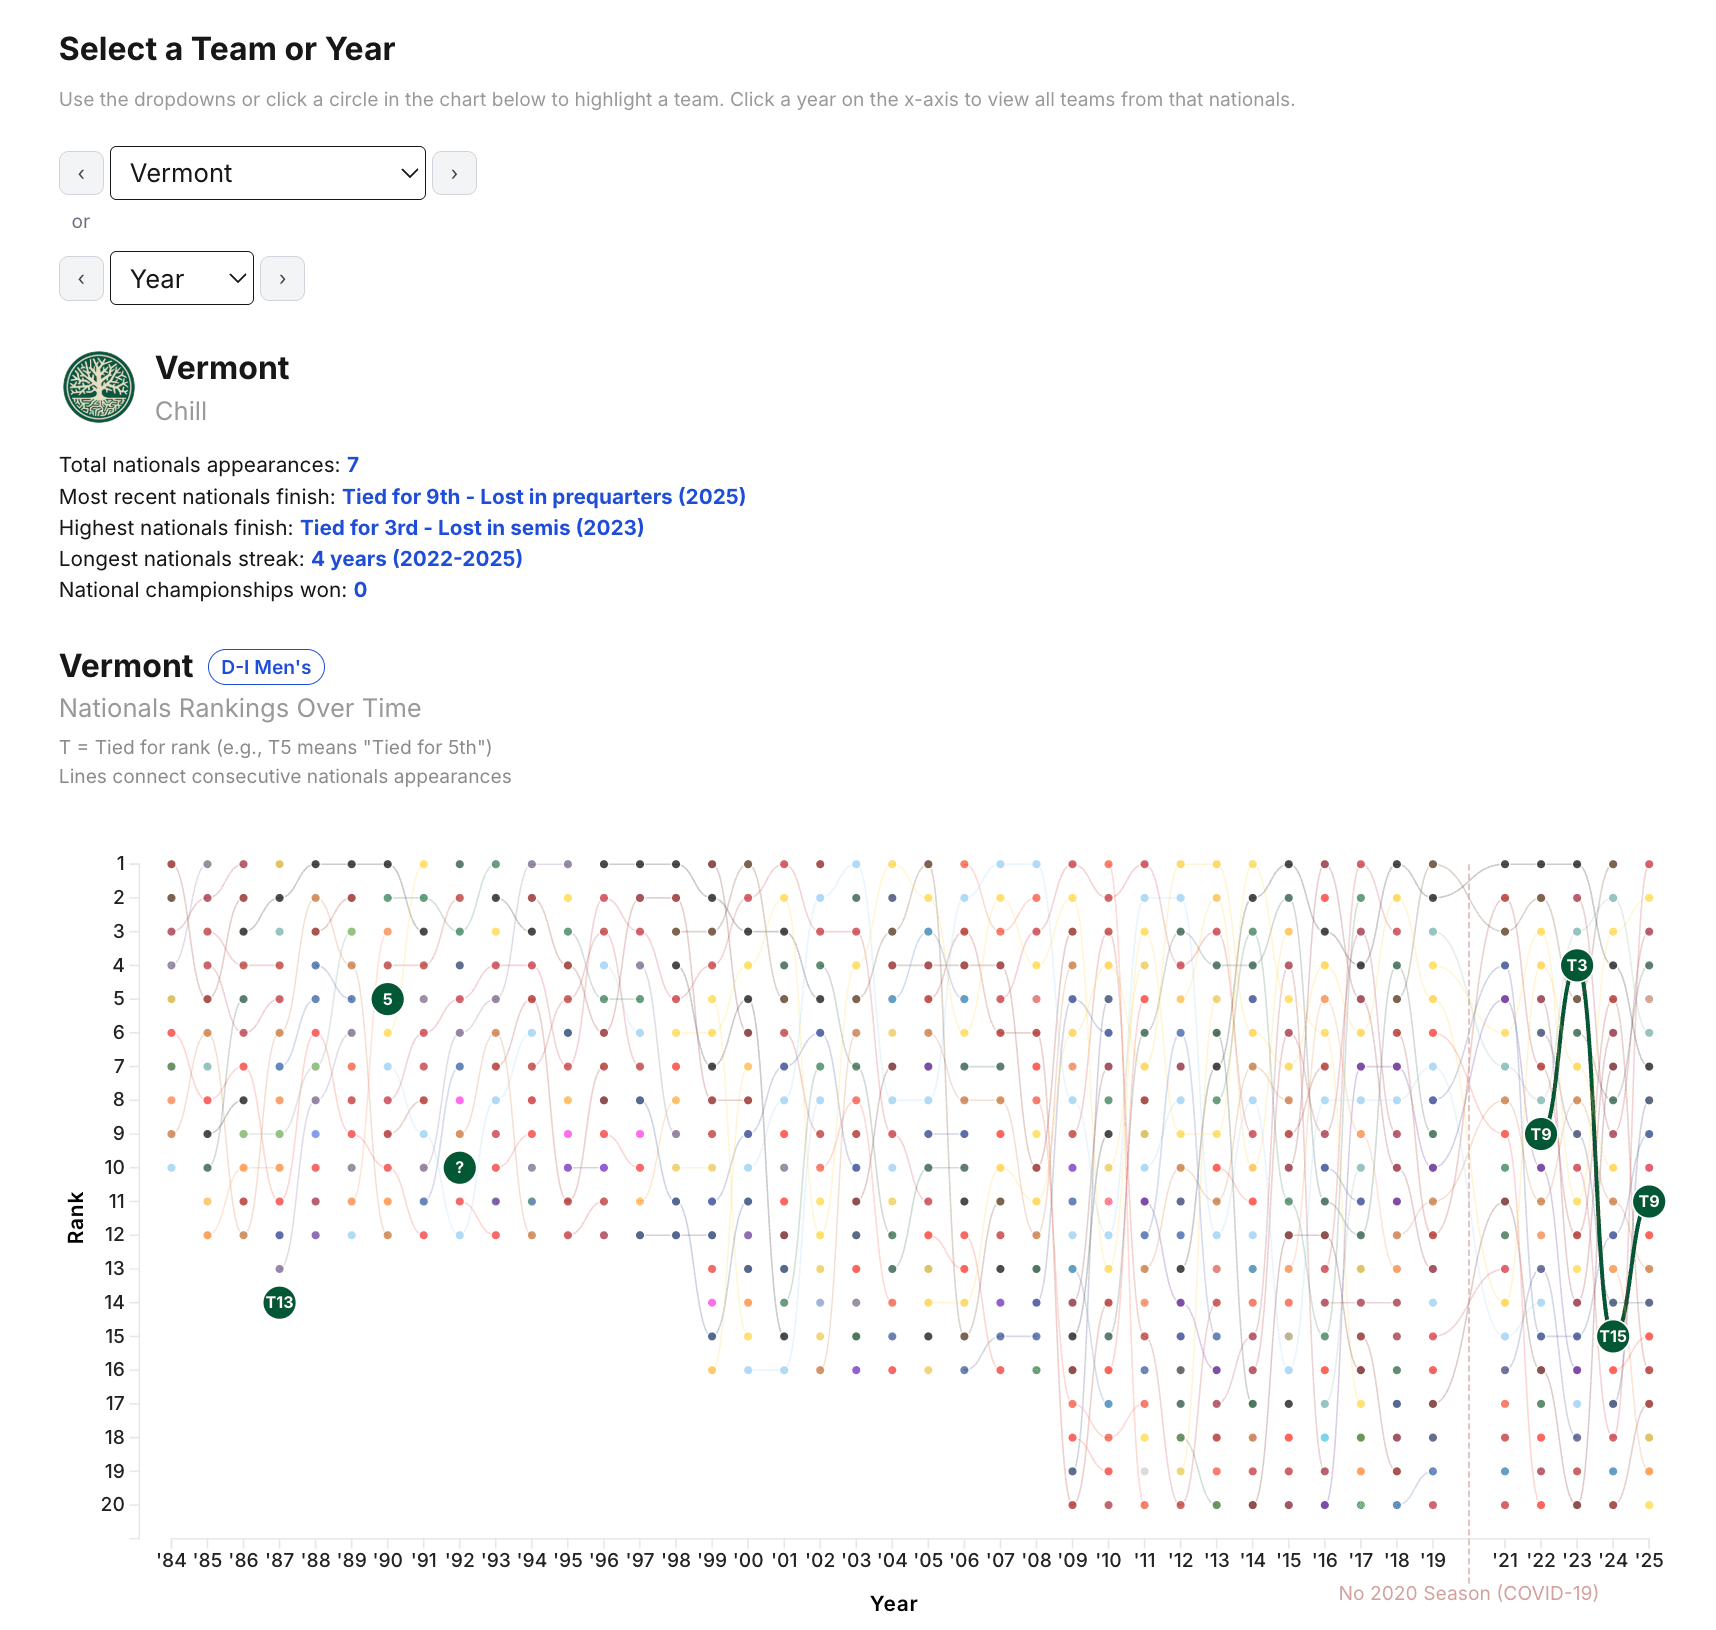
North Carolina, Carleton, UCSB, Wisconsin. We've all heard about these dynasties in the college ultimate world. But which teams have been good forever? Who's made nationals the most but never won a championship? Where should my kid apply to college if they want to go to nationals next year?
Before this project, there was no way to visualize college ultimate frisbee rankings over time. You could visit the USA Ultimate College Championships history page to see a list of past winners:

And you could drill into each year to see the full standings:

But there wasn't a way to see it all in one place: a flow chart of how teams finished year after year. Sure, we can memorize how a team placed in a certain year and open up 10 tabs to see how they did before and after, but what if we want to see the rise and fall of teams since 1984 up until the present?
Inspiration
I was inspired by bump charts that visualize team rankings over time in other sports. A bump chart shows time on the x-axis and rank on the y-axis, illustrating how teams changed rank as time passes. It is a logical and intuitive way to visualize ranking data, as the lines "bump" up or down based on yearly performance.
These two charts gave me a foundation for how I would build and visualize the dynasties:
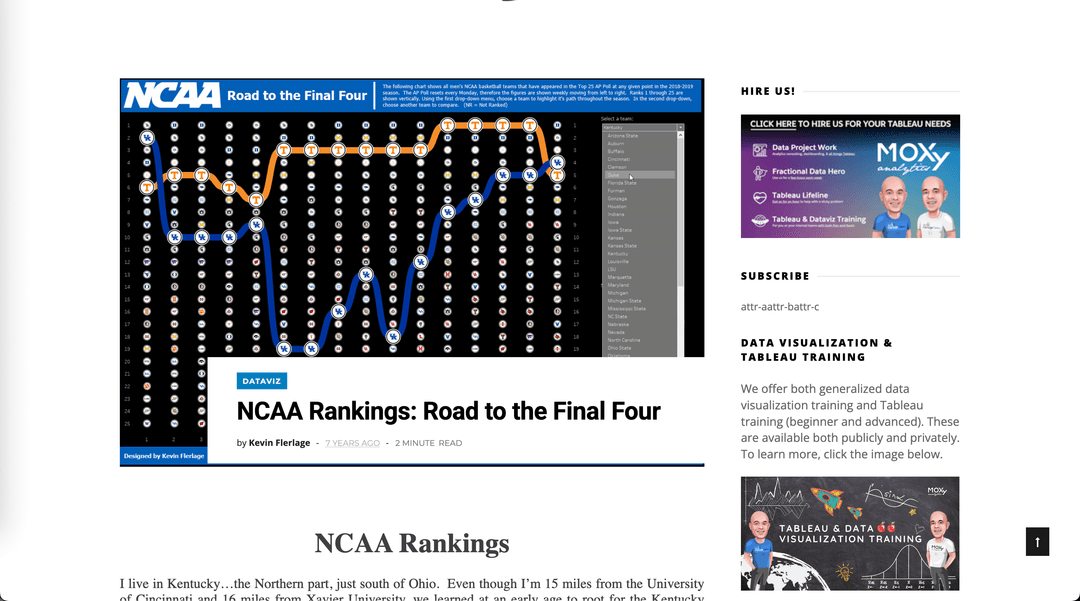
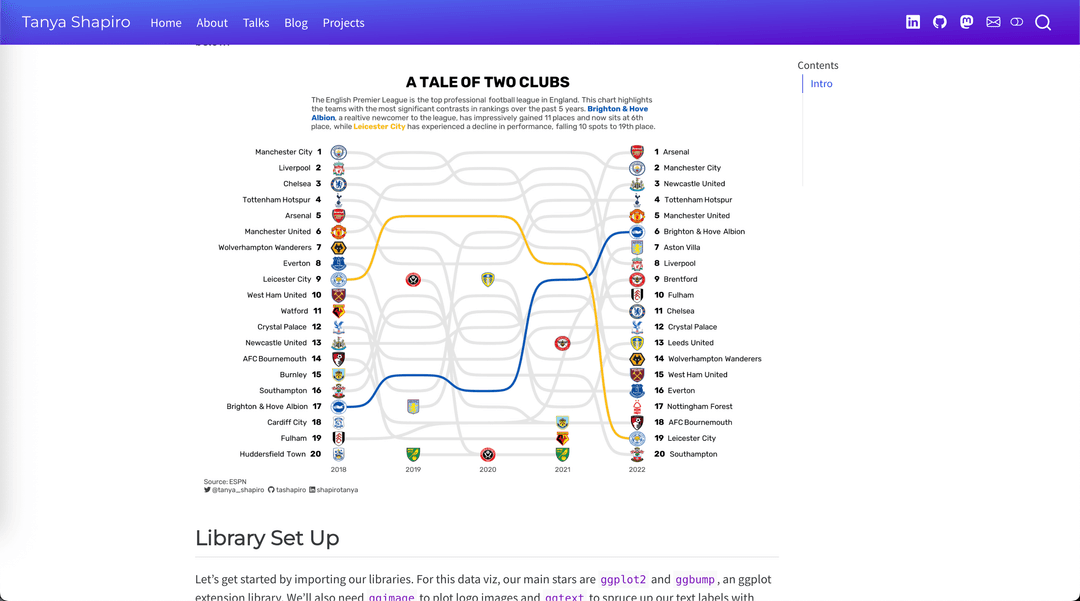
The Premier League chart especially influenced the design, showing how teams rise and fall over multiple seasons with smooth connecting lines and team logos for identification.
Data Collection & Processing
I scraped the ranking data from the USA Ultimate College Championships website, going through each year's results page to extract the final standings.
After a ton of data cleaning (handling tied positions, normalizing team names across years, dealing with missing data from early years), I compiled a final dataset for each division:
- D-I Men's (1984-present)
- D-I Women's (1987-present)
- D-III Men's (2010-present)
- D-III Women's (2010-present)
Each record contains:
- Team - School/team name (normalized across years)
- Year - The championship year
- Rank - Final placement (1st, 2nd, etc.)
- T_Rank - Tied ranking if applicable (e.g., T3 for "tied for 3rd")

Sample of the final cleaned dataset
I also knew I wanted each team's logo and nickname, which I found on Ultiworld.

Using these logos as a reference, I manually assigned a primary team color for each school, which I compiled into its own separate dataset. This allowed the final visualization to consistently use each team's recognizable brand colors.

Team color hex code dataset
Iterative Design & Chart Building
Phase 1: Foundation
Initial proof-of-concept using a basic line chart to test the bump chart logic with all teams in gray and the active team highlighted in red while prototyping.
Phase 2: Visual Clarity
Iterating on the background grid and highlight colors to ensure the primary team path stands out against the historical noise.
Phase 3: Direct Labeling
Adding ranking numbers directly to the dots, plus a chart title and cleaned-up axis labels. This reduces the need for tooltips and makes results scannable at a glance.
Phase 4: Path Refinement
Adding a team-specific highlight color so the active team is easy to track, and the visualization starts to feel tied to each program’s identity.
Phase 5: Polishing Process
Playing with opacity and emphasis to find the best usability: keeping context from other teams without overwhelming the active team’s path.
Phase 6: Team Statistics
Integrating a summary dashboard at the top (total appearances, best finish, and more), then refining the information hierarchy and typography so the team header reads quickly.
Phase 7: Layout Experiments
Experimenting with how the team stats are presented (including a horizontal layout) to see what stays readable while keeping the chart front-and-center.
Phase 8: Data Validation
Adding the most recent data, validating edge cases across years, and doing final polish passes to make sure the full timeline tells a consistent story.
Phase 9: Interaction Design
Adding the searchable team dropdown and year navigation controls for deeper exploration, plus final details like polished summary stats, team nicknames under the school name, a key for abbreviations, and a persistent division label so you always know what you’re viewing.

Phase 10: Final Refinements
Tuning dot size and line opacity for clear scanning and visual clarity, especially when many seasons overlap and the chart gets dense.
Visualizing Success: Small Multiples & Sparklines
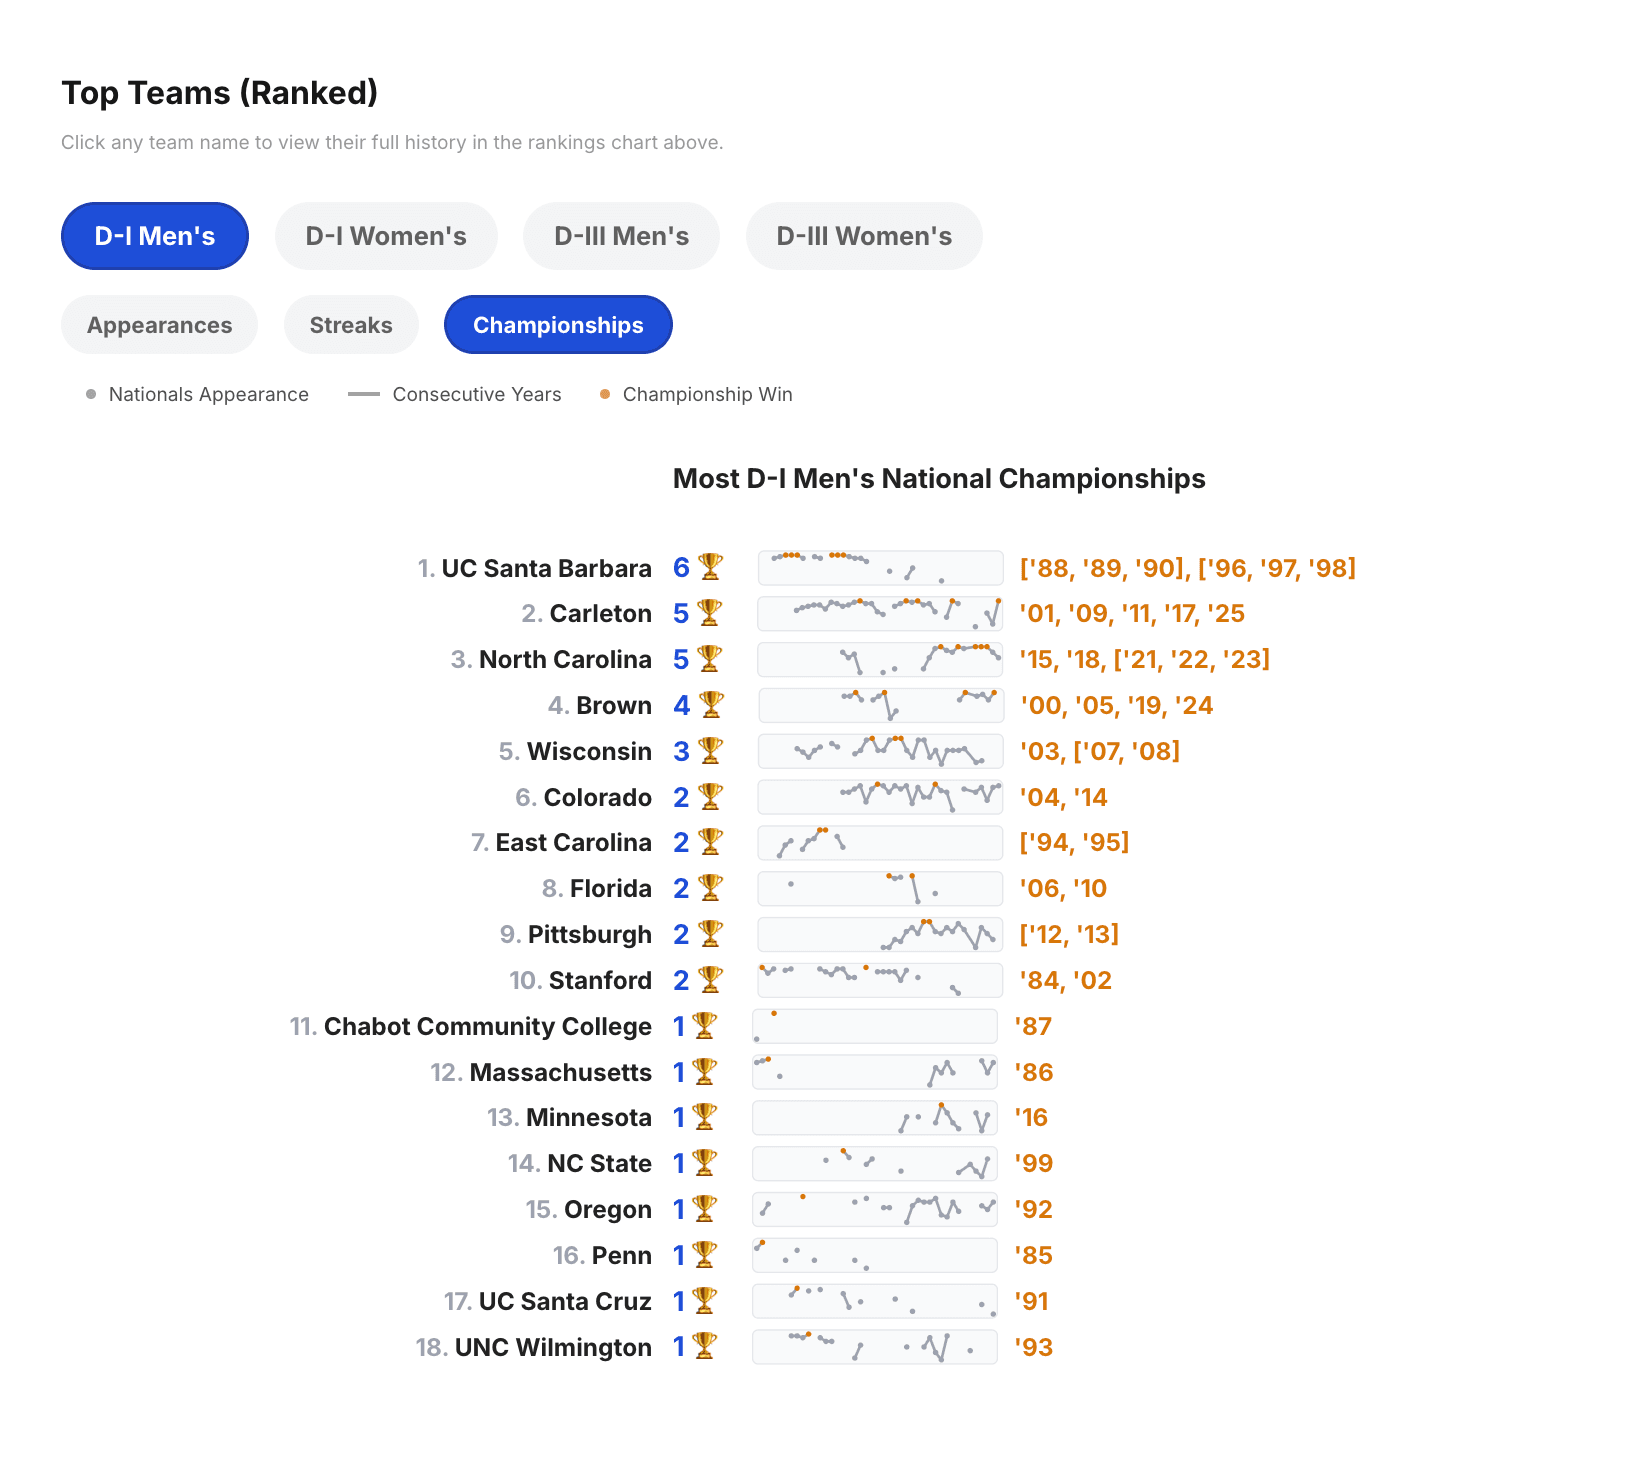
I initially created a standalone visualization to track the number of championships won by the winningest teams. This provided a high-level view of who has dominated the podium.
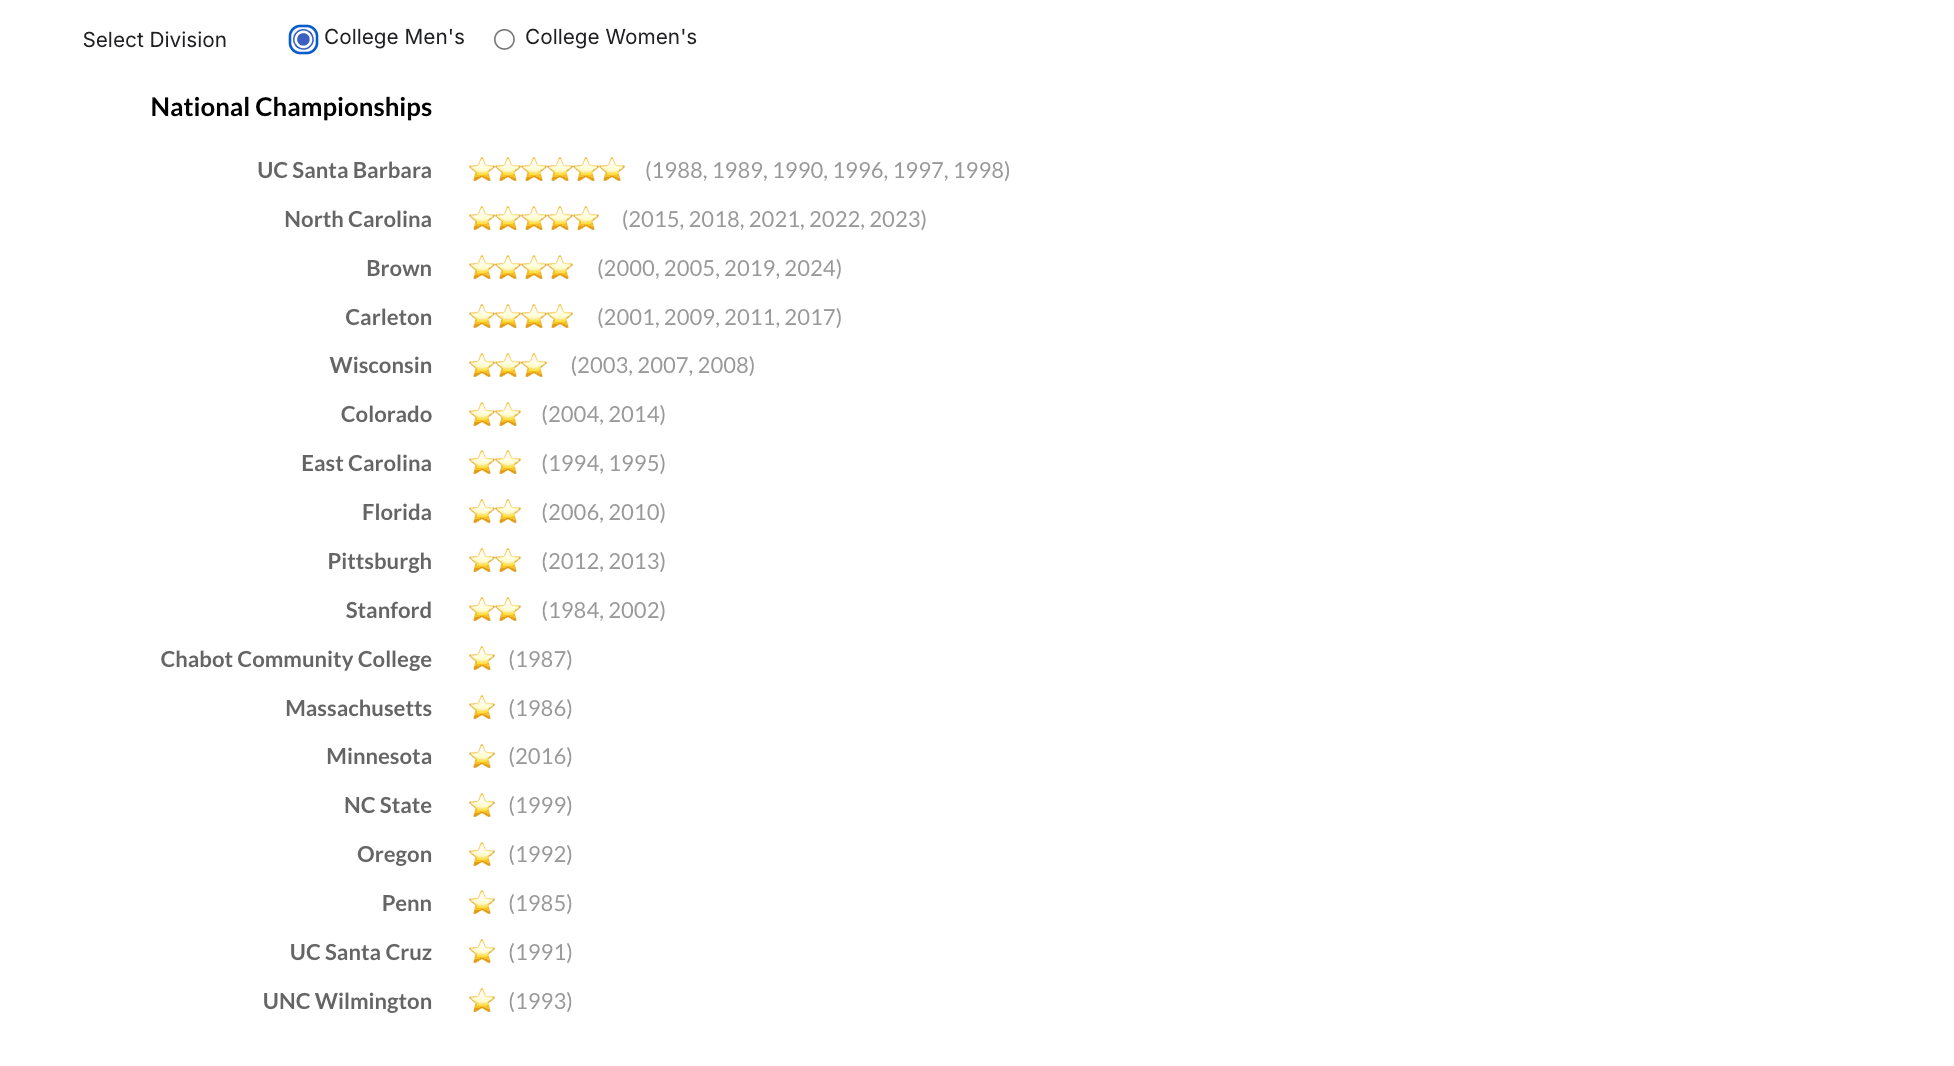
I improved upon this by developing a set of small multiples and sparklines. This simplified version shows championship wins and how they fit into the timeline of the larger main dynasties chart.
I then expanded this framework to visualize two other key metrics:Total Appearances and Consecutive Streaks.

Teams ranked by total Nationals appearances
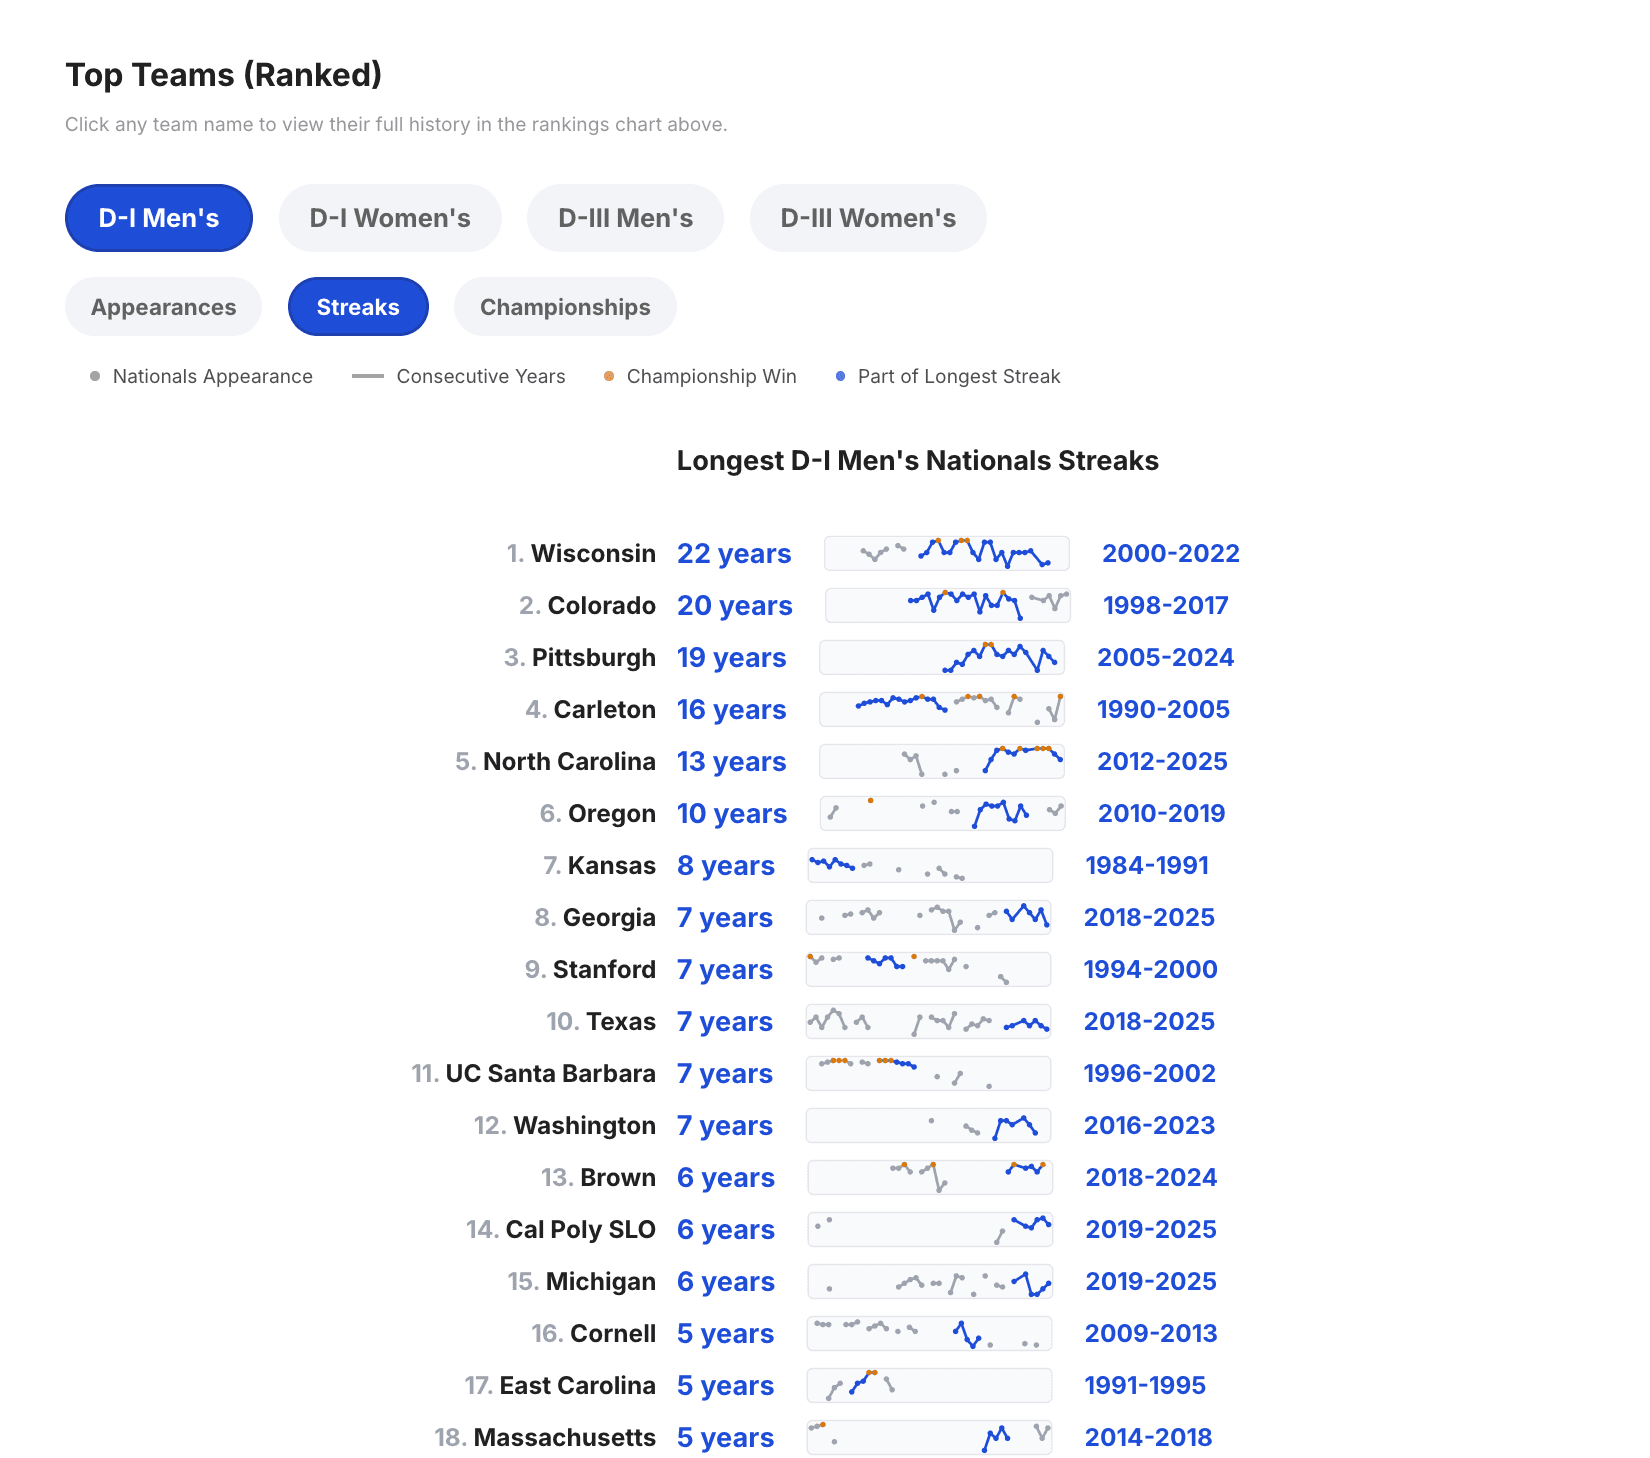
Teams ranked by longest consecutive appearance streaks
This allows users to see teams ranked in order of these three metrics, providing a multidimensional look at what makes a "dynasty" in college ultimate.
Findings
This chart has made it possible to observe patterns such as:
Men's Division
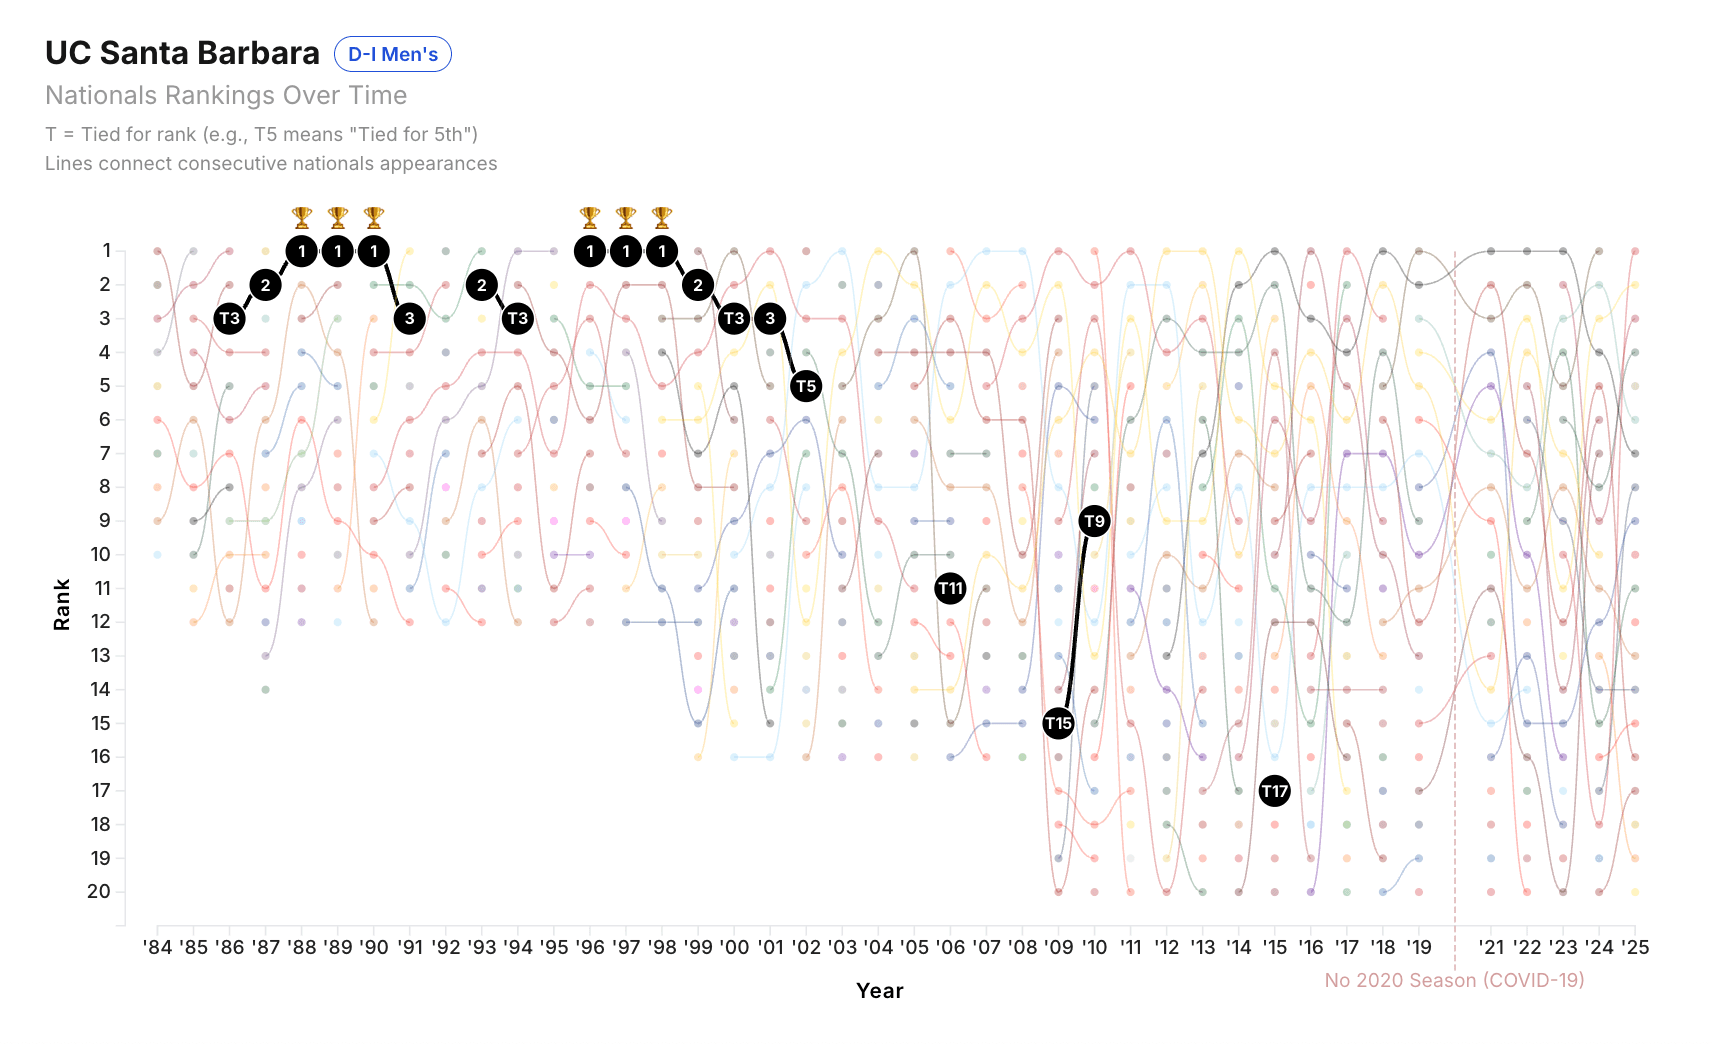
UCSB won back-to-back-to-back twice, and you can see their slow climb from third in 1986 to second in 1987 to winning for the first time in 1988. But why didn't they make Nationals in 1992, only to lose in the finals in 1993?
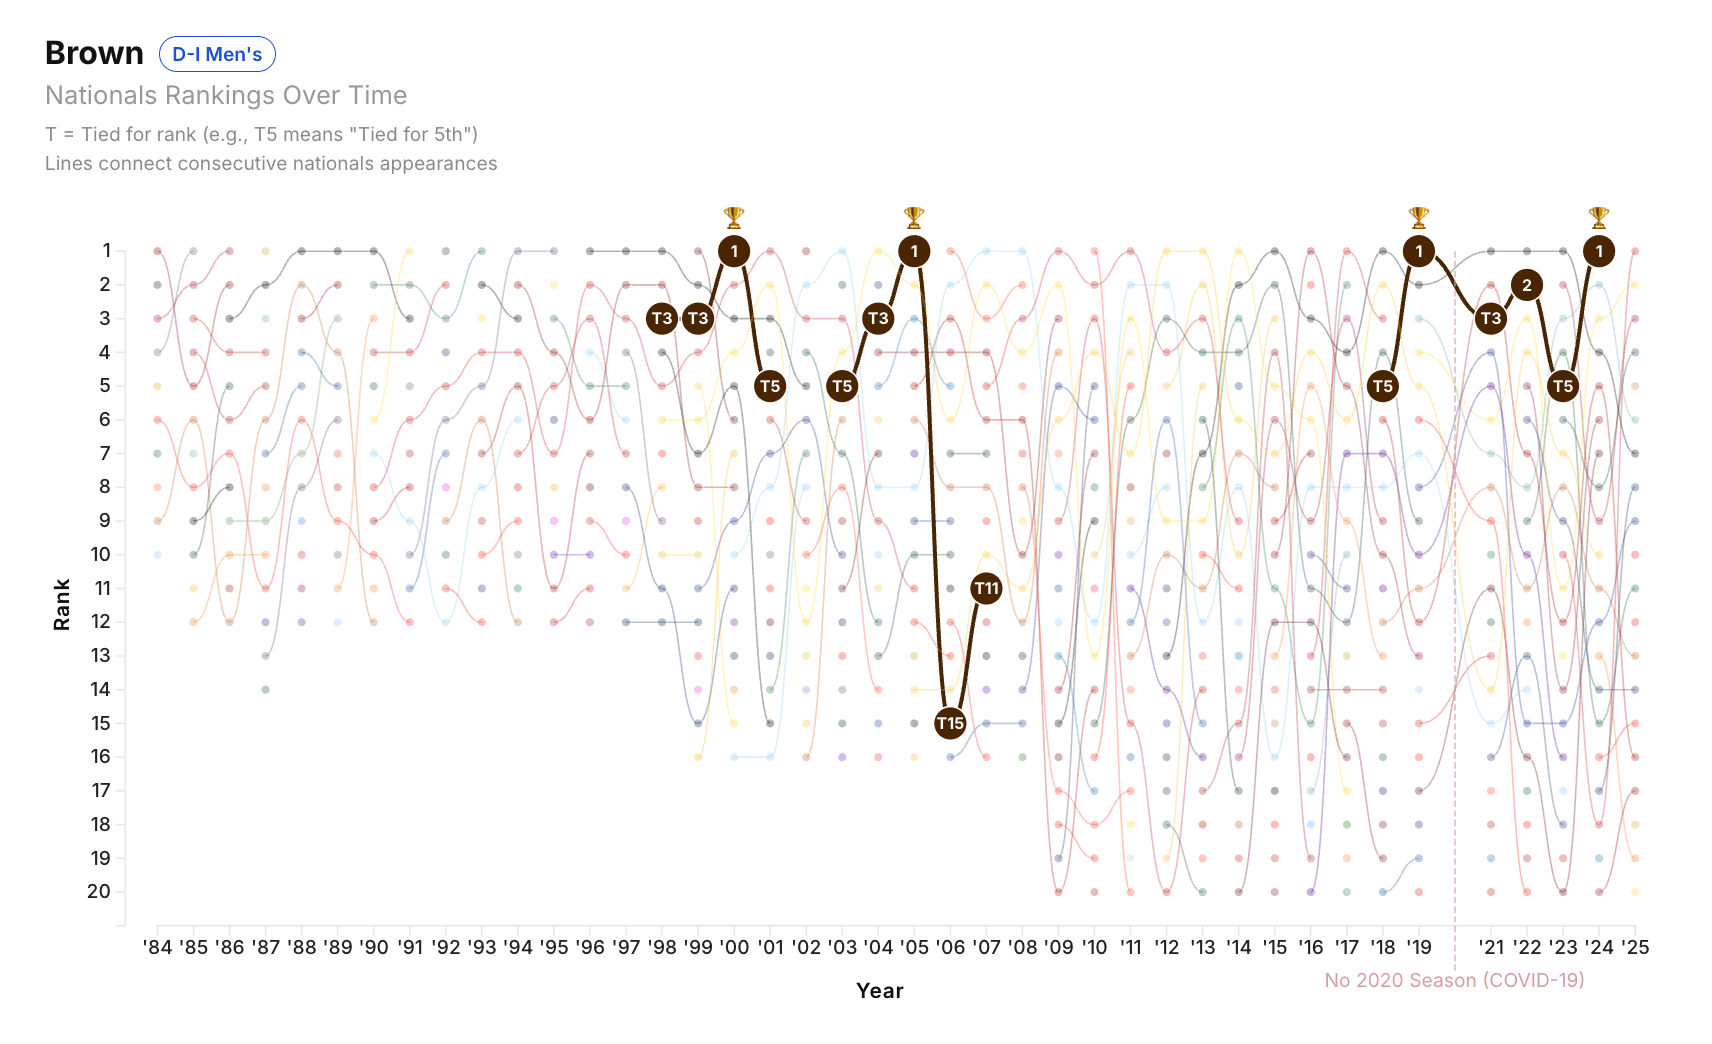
Brown has a clear legacy in the early 2000s, with wins in 2000 and 2005, but a huge break from 2008 to 2017 before gaining dominance again in 2019 and 2024.
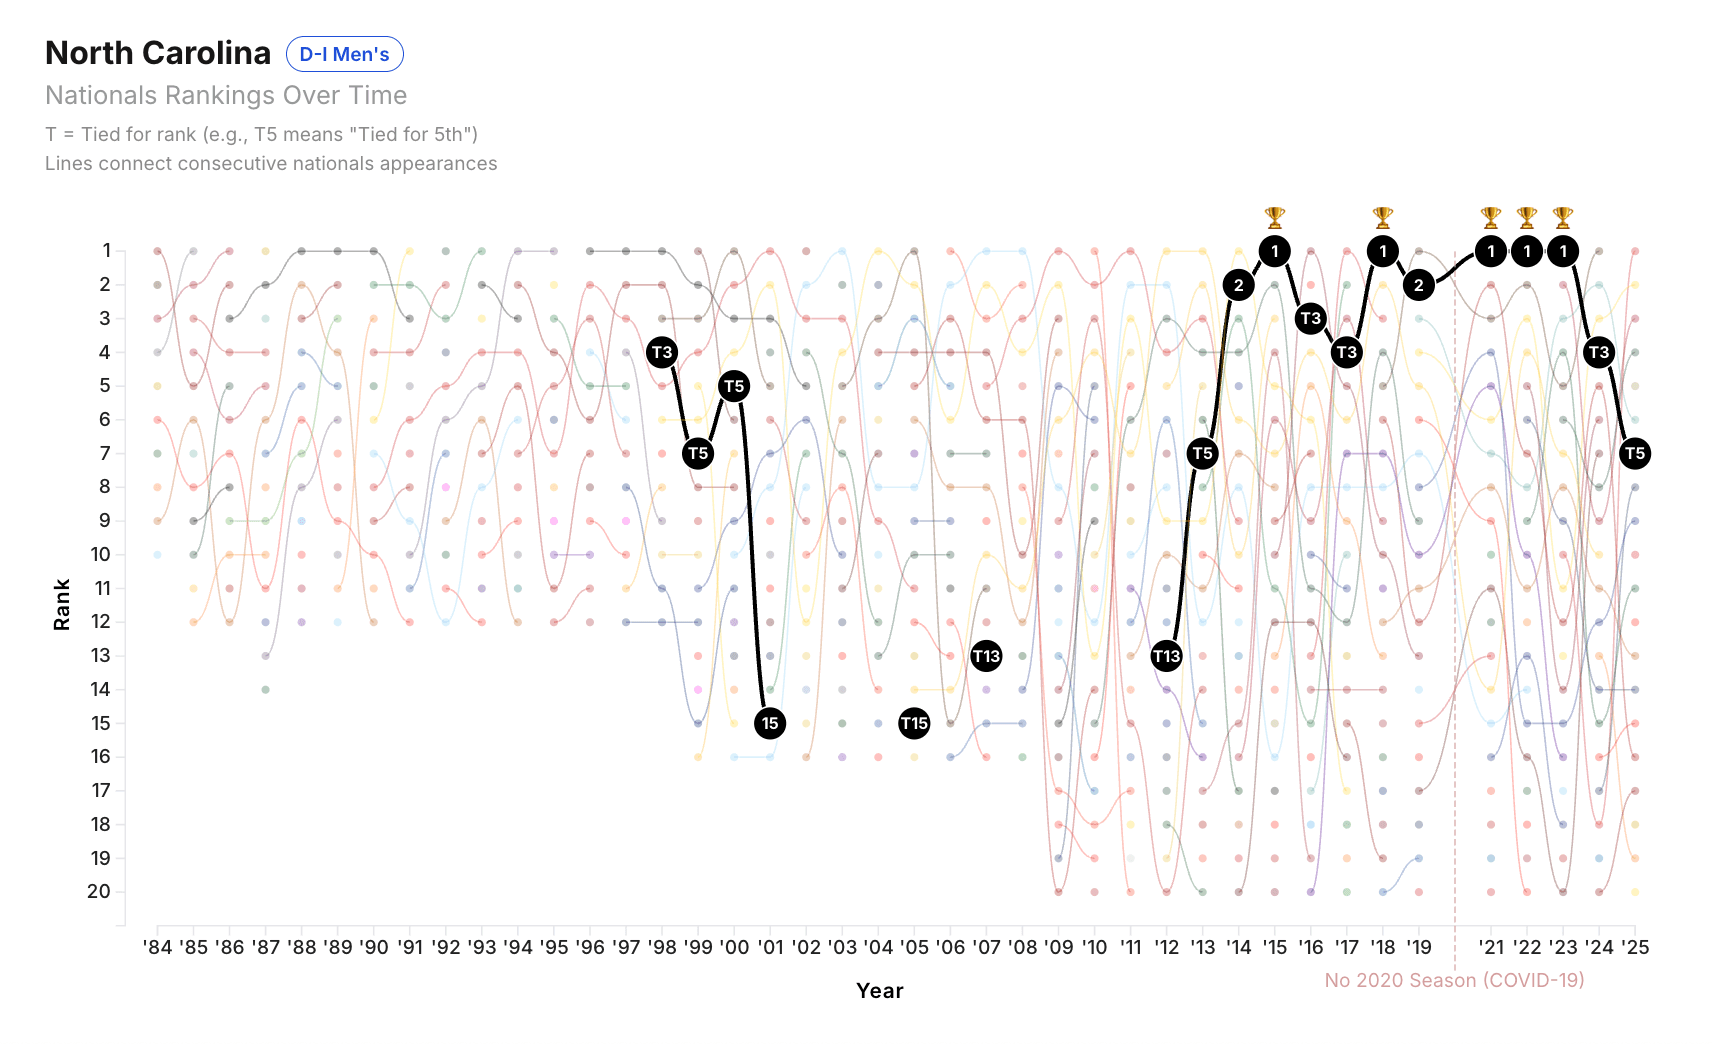
North Carolina is obviously another major legacy, having made Nationals every year since 2012. But they were late to the game, not qualifying for the first time until 1998, and missing Nationals for seven years in the mid-2000s.
- Texas with a history of mediocrity
- Oregon only winning once in 1992
- UMass getting second after missing Nationals three years in a row
- Michigan never placing above third
- Florida dropping from first to dead last in 2010 to 2011
- Wisconsin getting 5th four years in a row
- East Carolina never making Nationals after 1998
- Notre Dame making it once in 2000
- Cal Poly's recent success post 2016
Women's Division
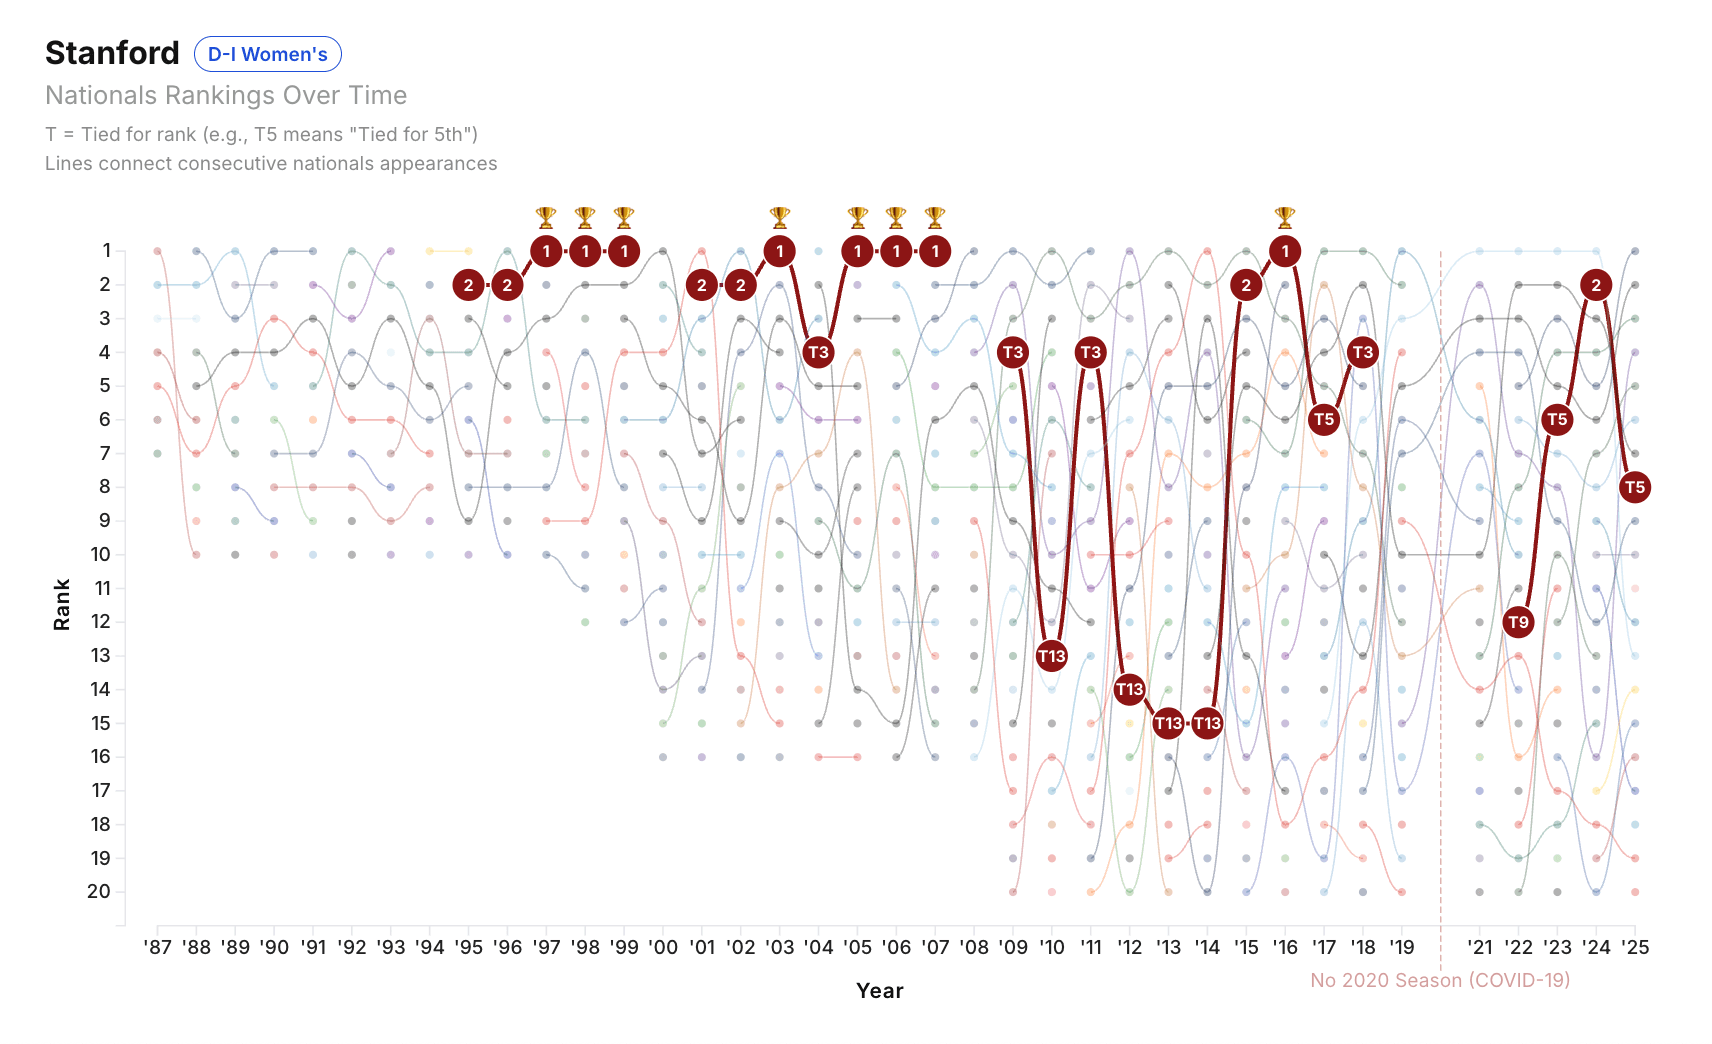
Stanford is far and away the best women's team ever with eight championships. They even went back-to-back-to-back twice. They made Nationals for the first time in 1995, lost in the finals twice, won Nationals three years in a row, and then didn't make Nationals in 2000, only to go on another crazy seven-year streak until they didn't make it again in 2008.
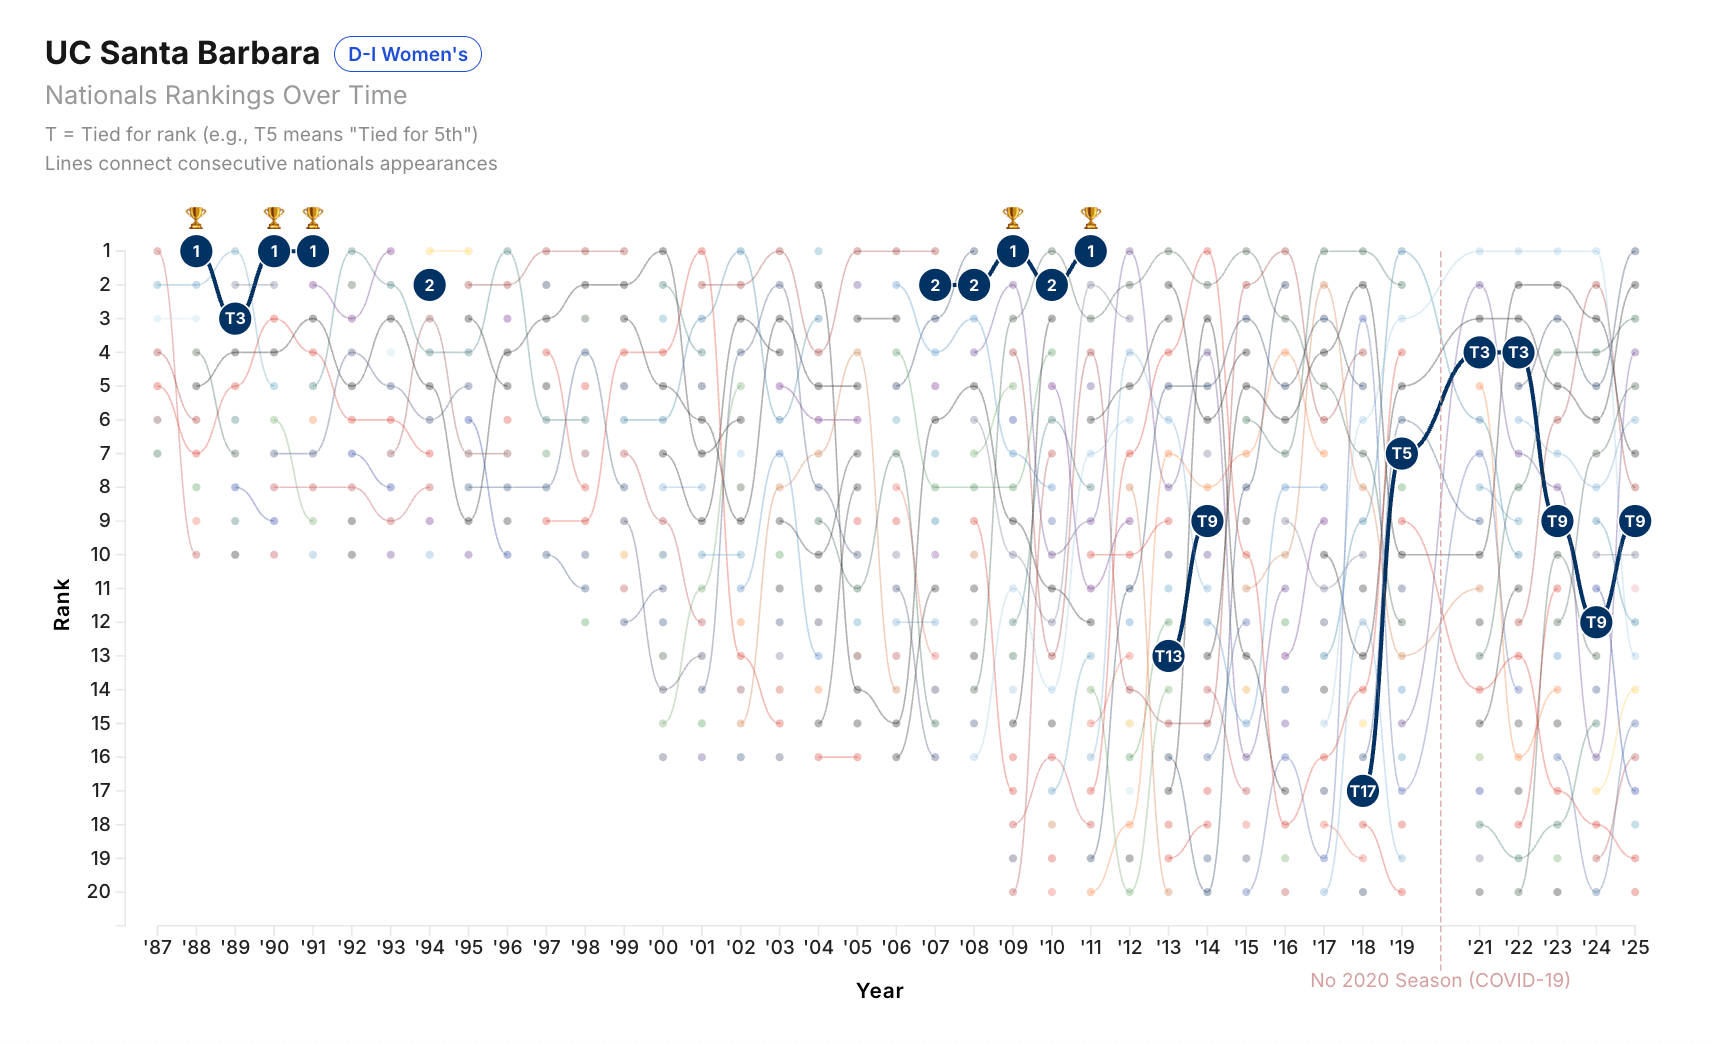
UCSB has also been strong, but with more concentrated spurts of success in 1988 to 1991 and 2007 to 2011. They also haven't missed Nationals since 2017.
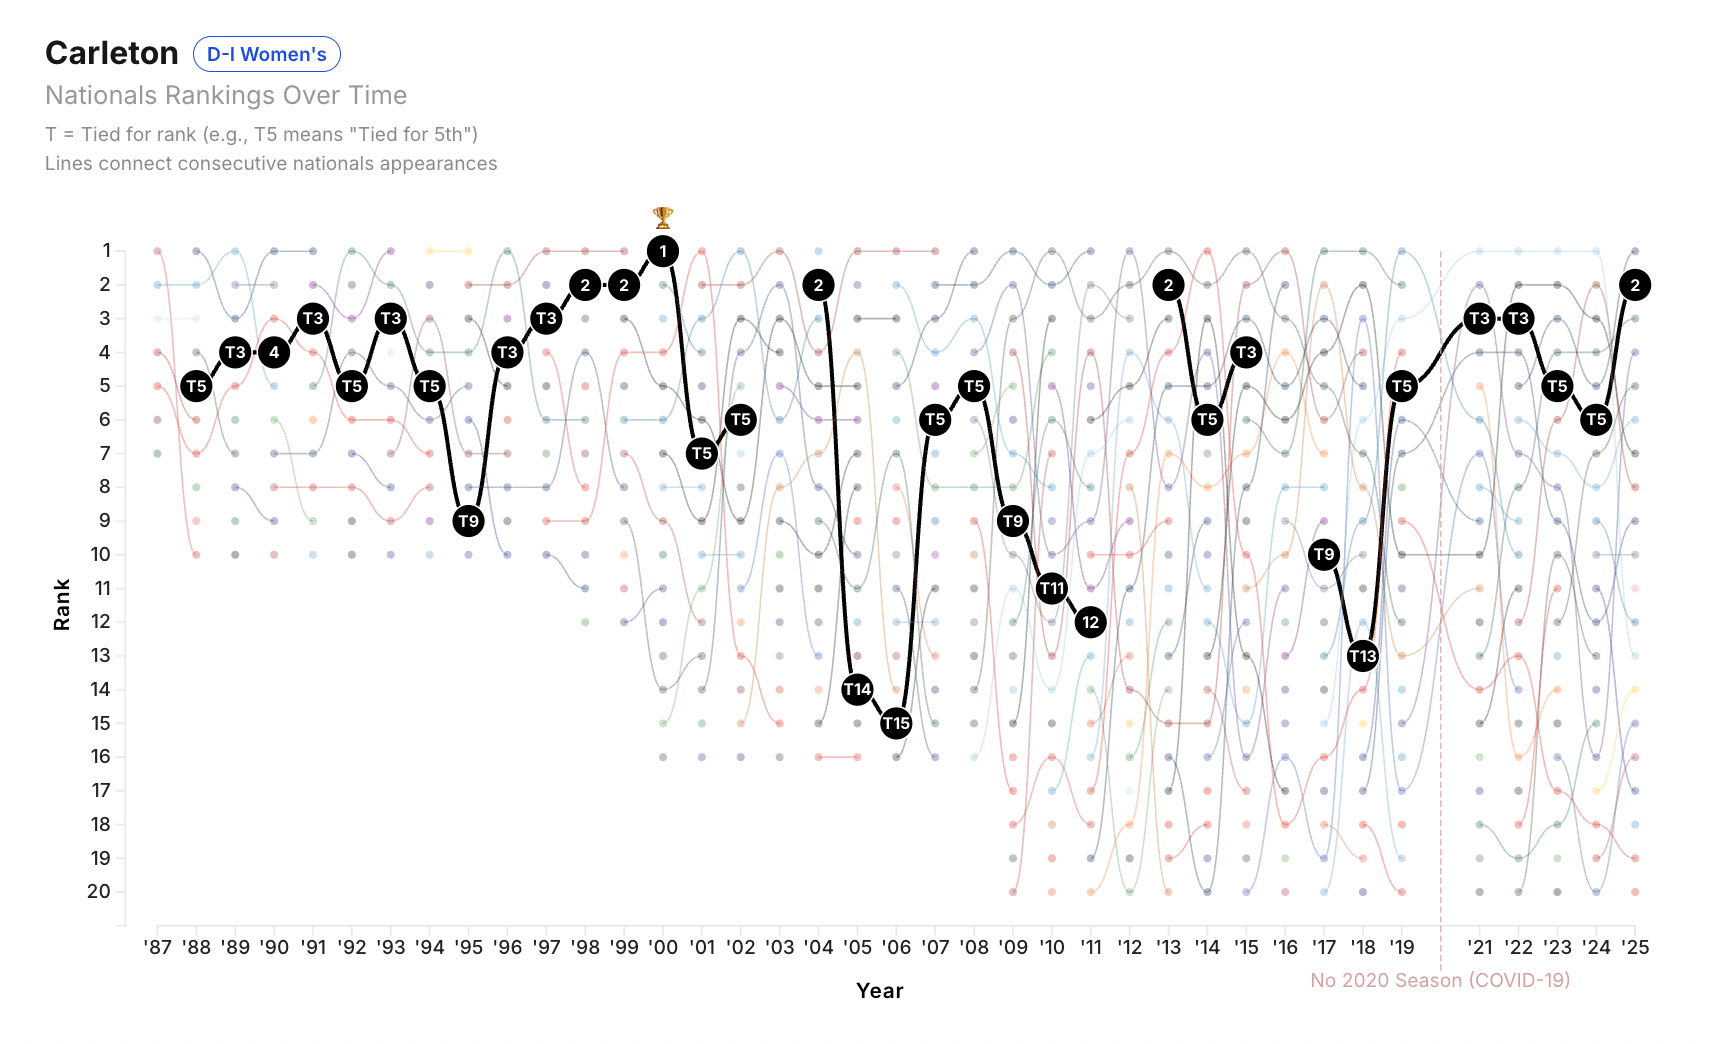
Carleton has only missed four Nationals total in the history of the sport, but only have one national championship in 2000.
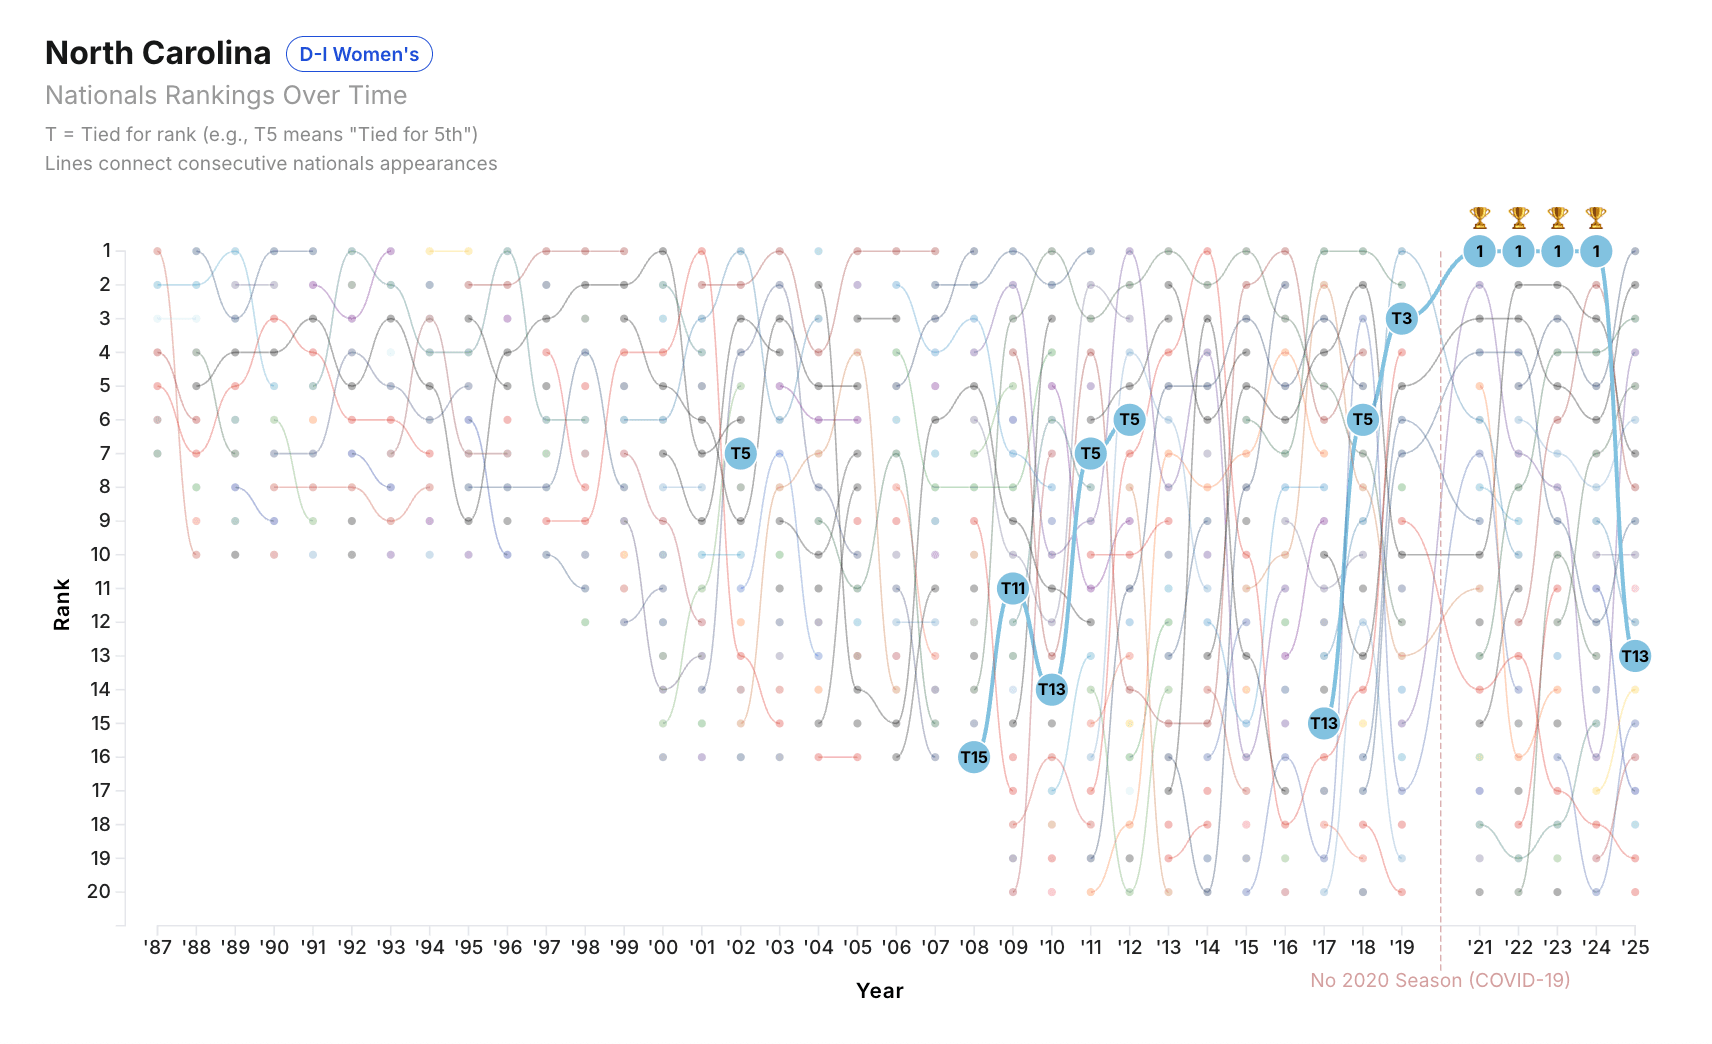
North Carolina Women's four-year win streak is unprecedented, as they're the only team to ever win the college championship four years in a row.
- UC Davis winning Nationals in 2004 after not making it the three years prior and not making it again until two years after
- UBC's slow climb to the top since 2006 and inability to make it past semis since their win in 2008
- Oregon's dominance in the 2010s
- Dartmouth's back-to-back victories in 2017 and 2018 followed by a loss to UCSD in 2019
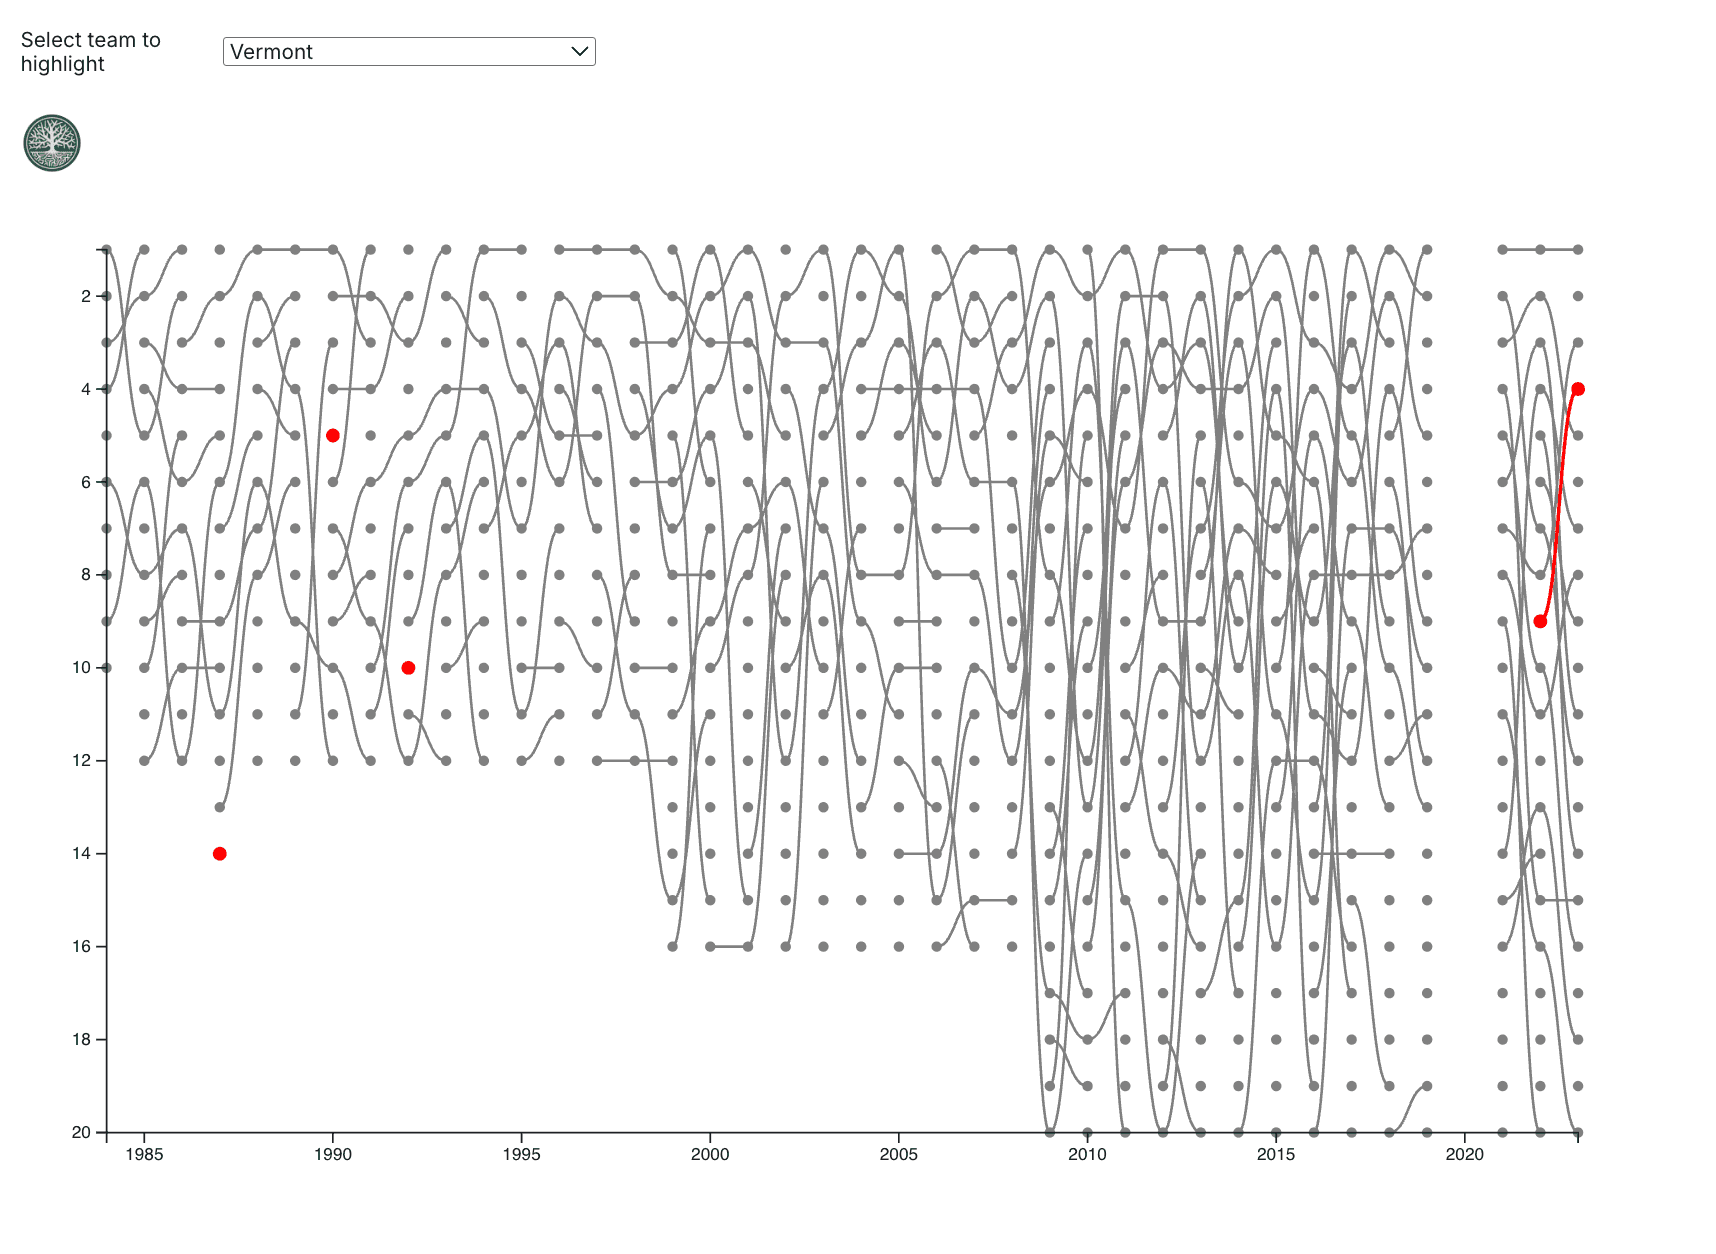
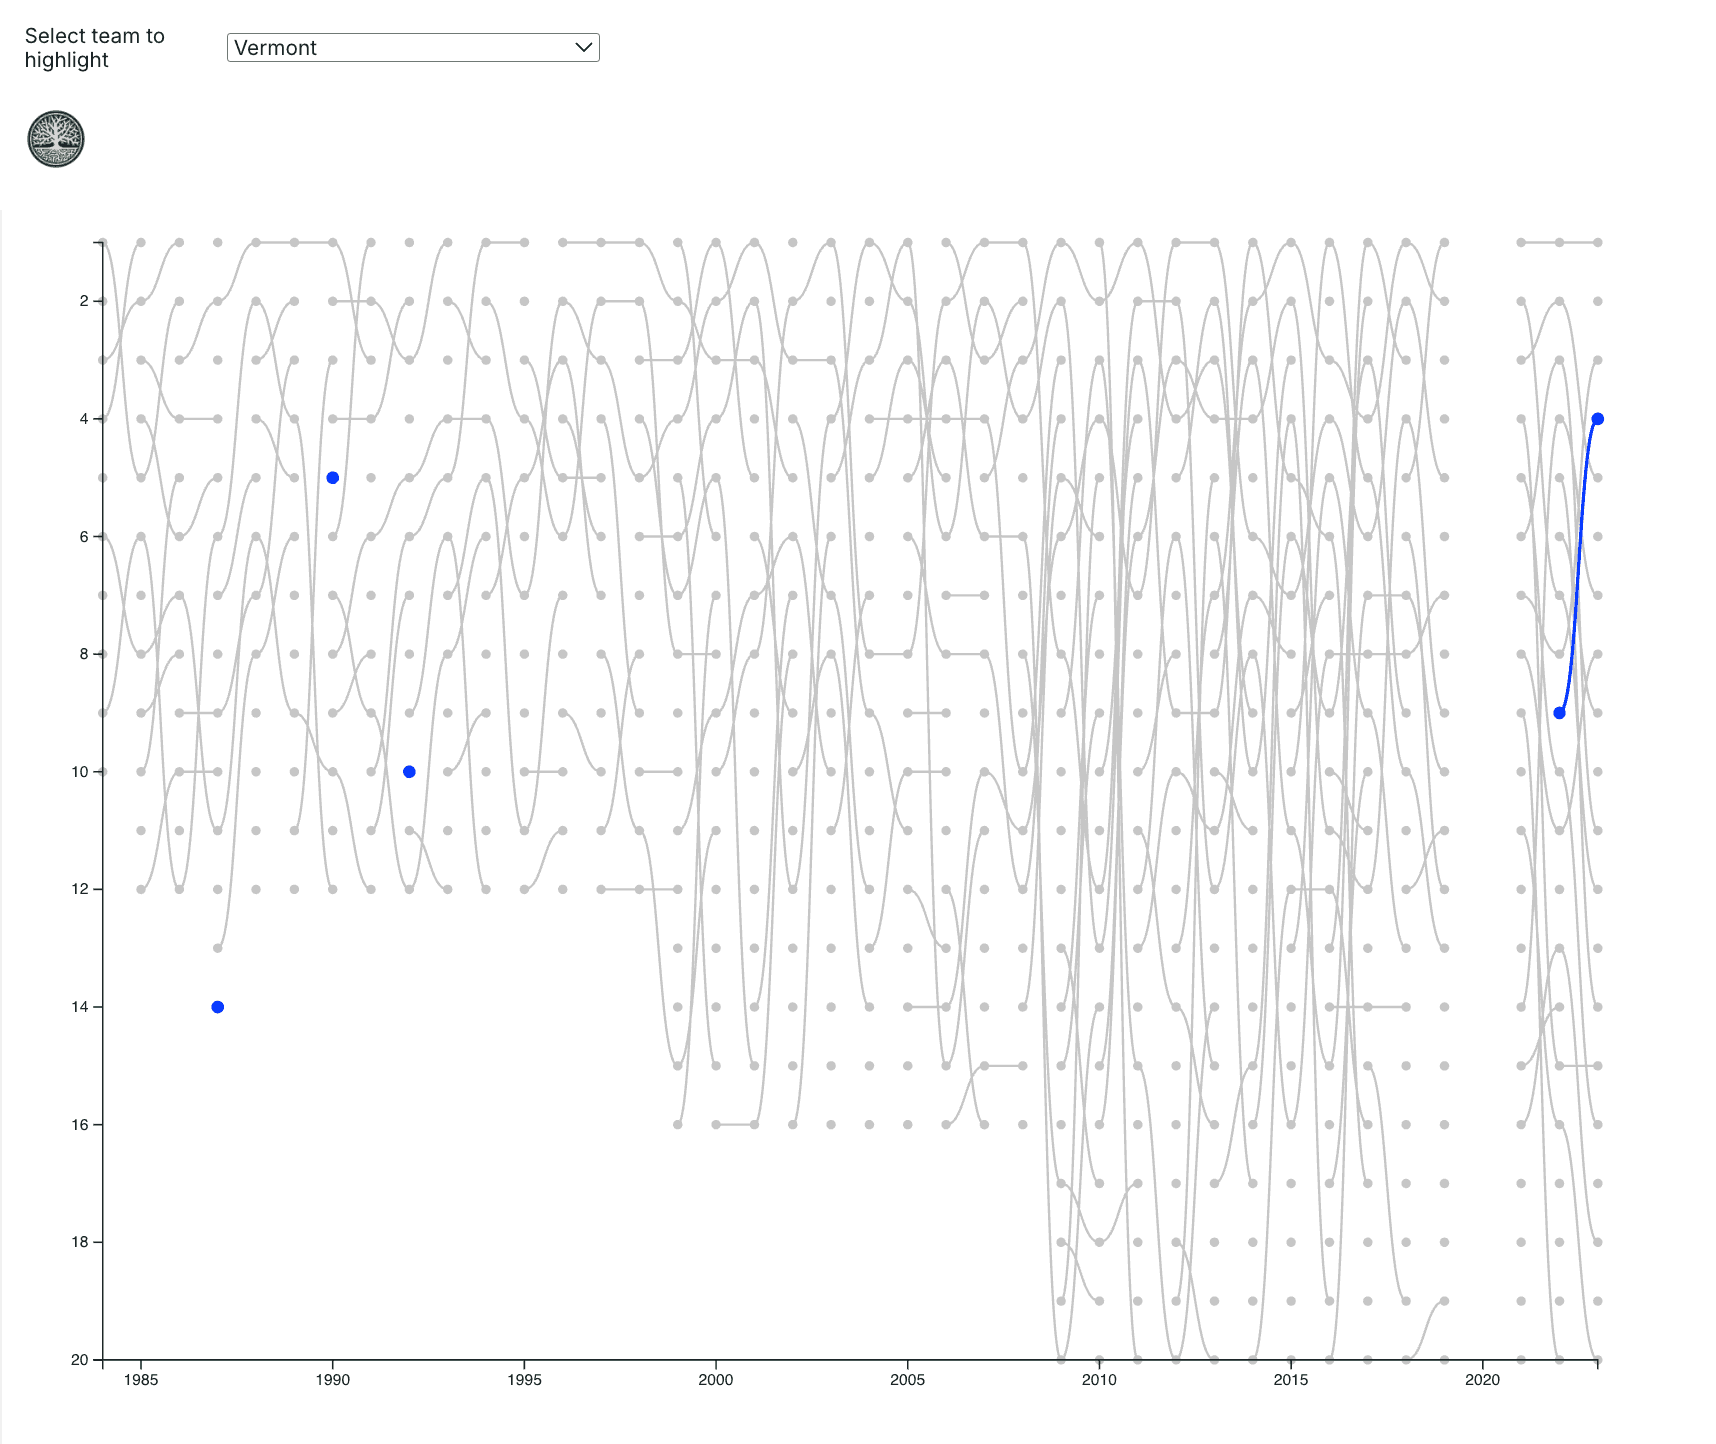
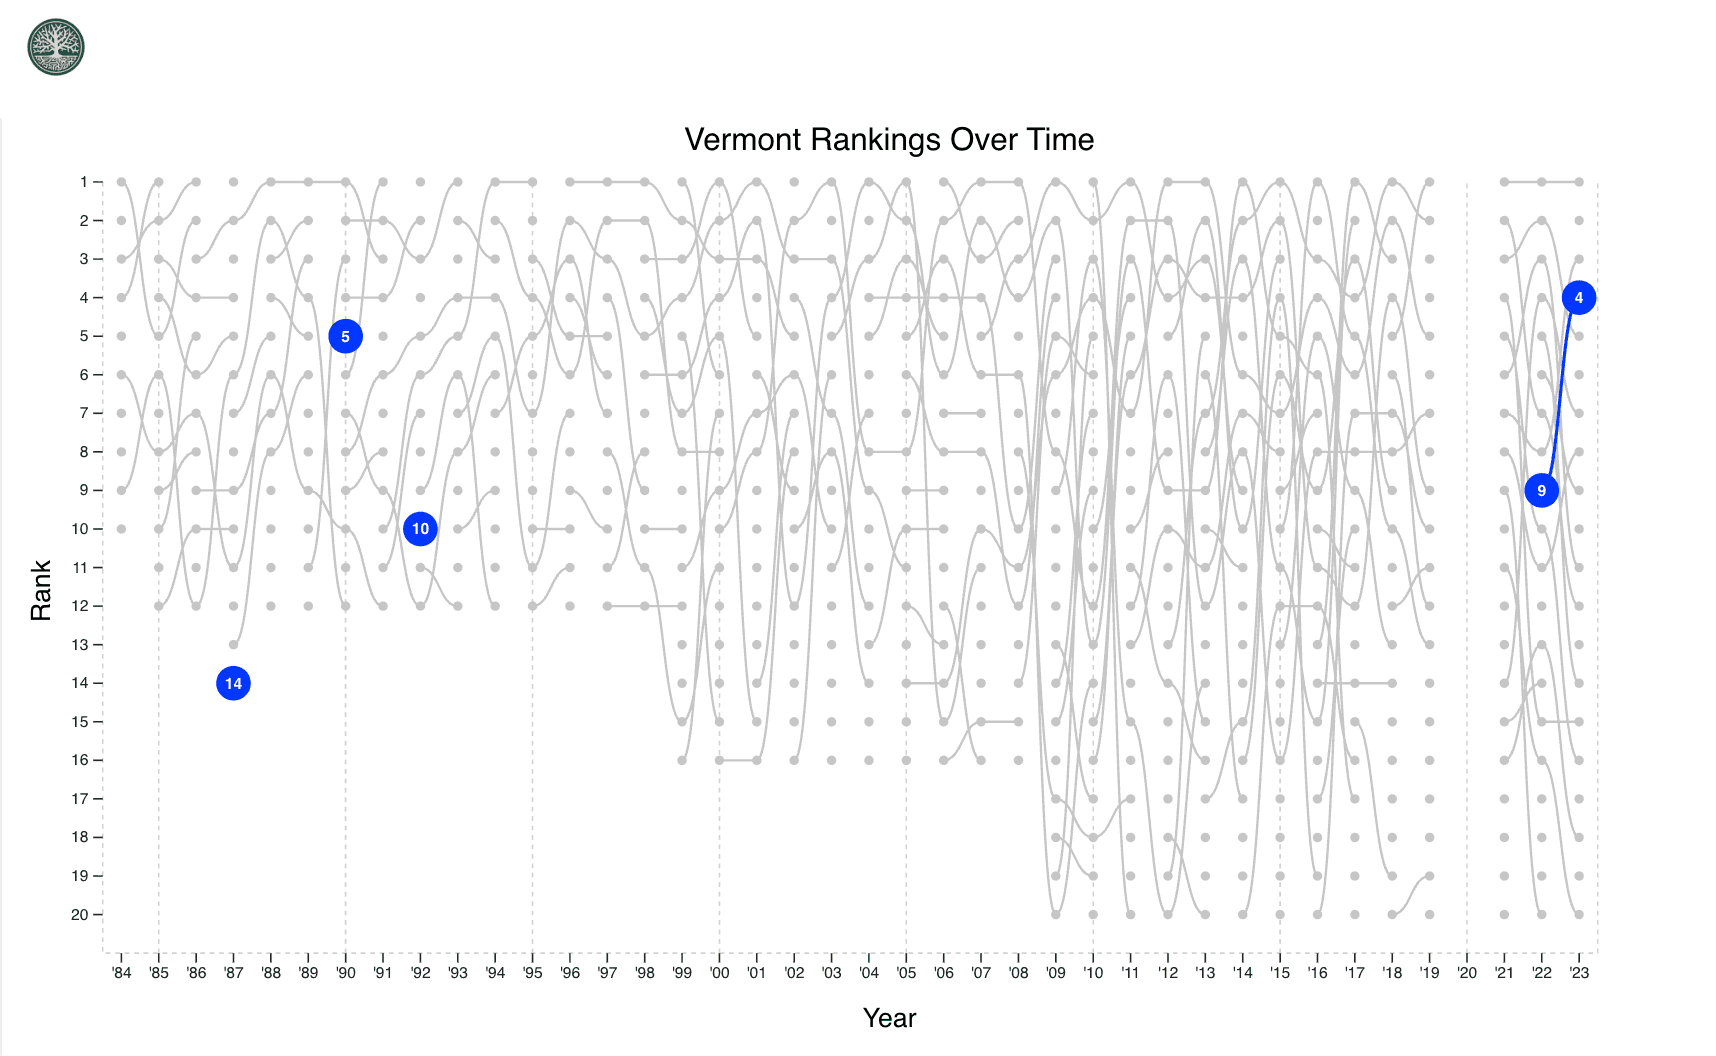
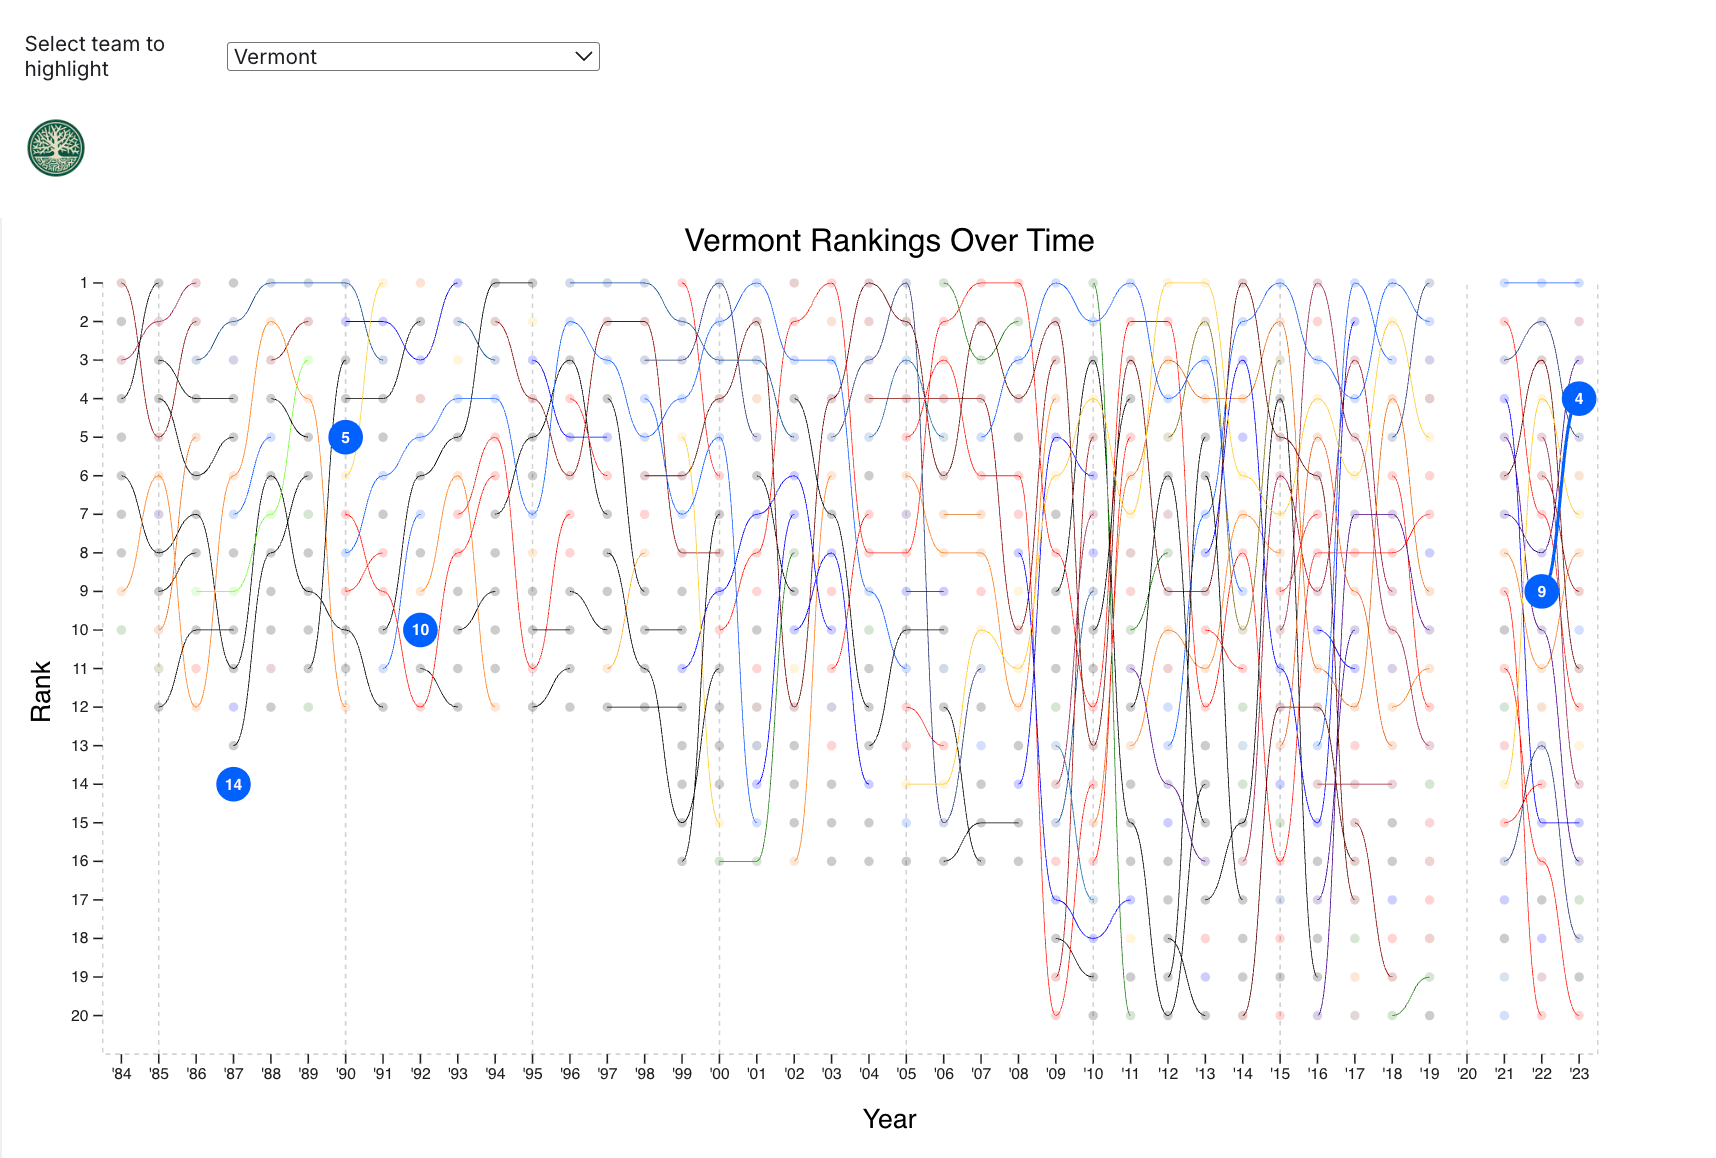
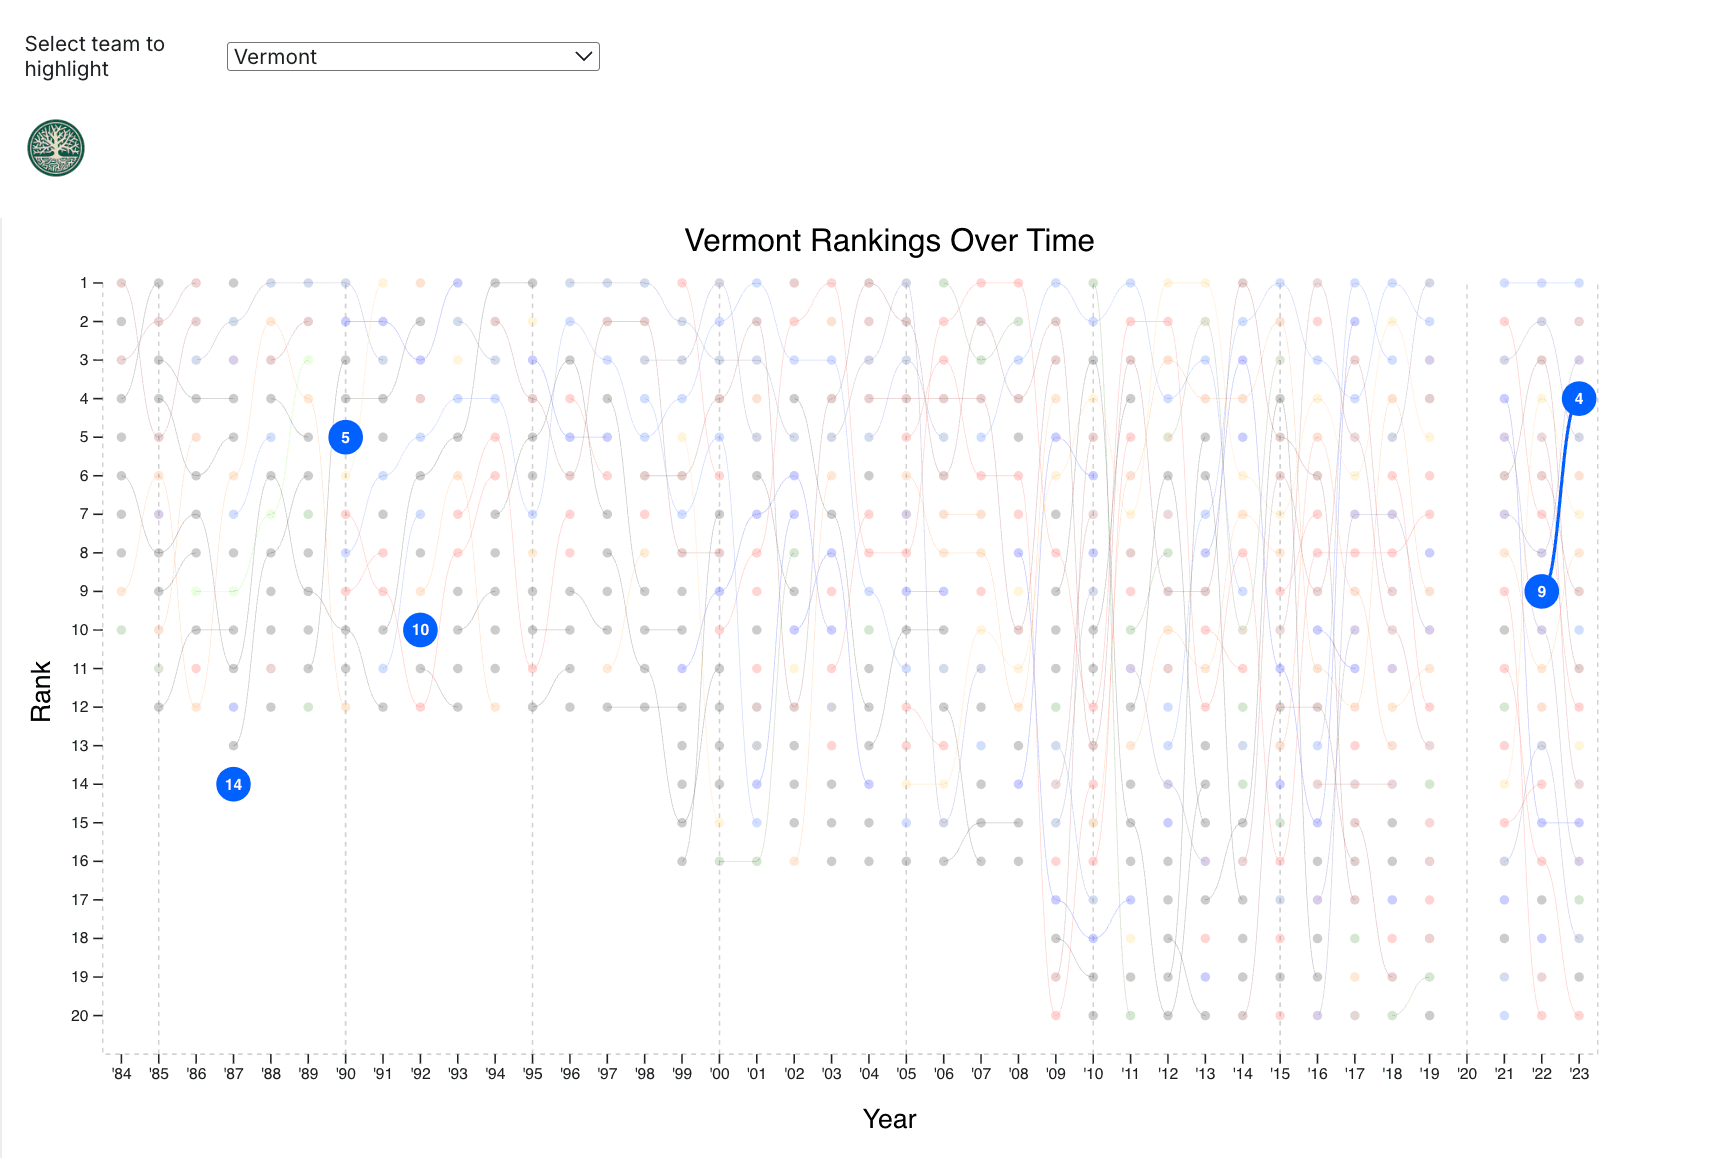
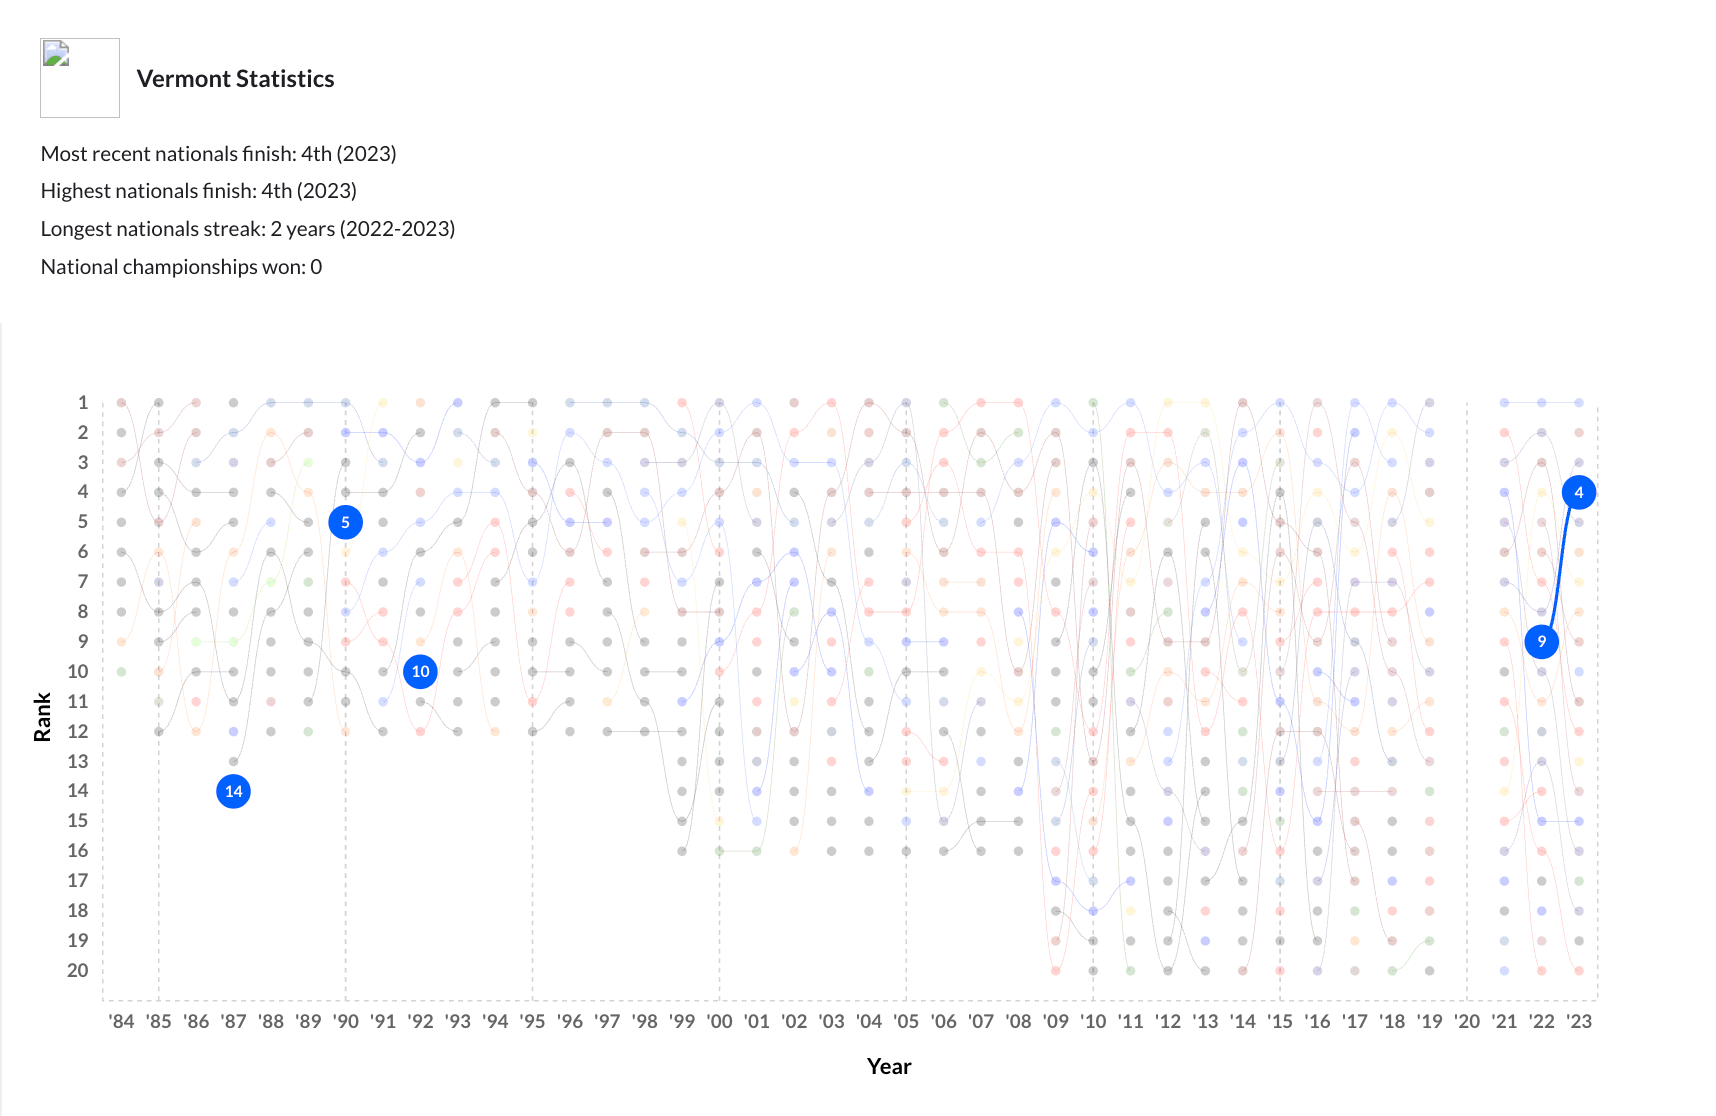
- Vermont making Nationals for the first time since 1984 in 2021
- Whitman's three-year ride from last to 5th to 2nd in 2016
- UCLA making Nationals for the first time ever in 2006, only to lose in finals and then never make it past semis